PThere are a lot of options out there for people who want to create a digital map. That’s why we created this handy comparison to help you figure out which map platform is right for your digital heritage project.
Content warning: some of the example maps here are analysing topics such as the Holocaust and the Transatlantic Slave Trade.
Google Maps:
You already know what Google Maps is, so we’ll be brief. Google Maps is brilliant for surfacing places to users and getting them there.
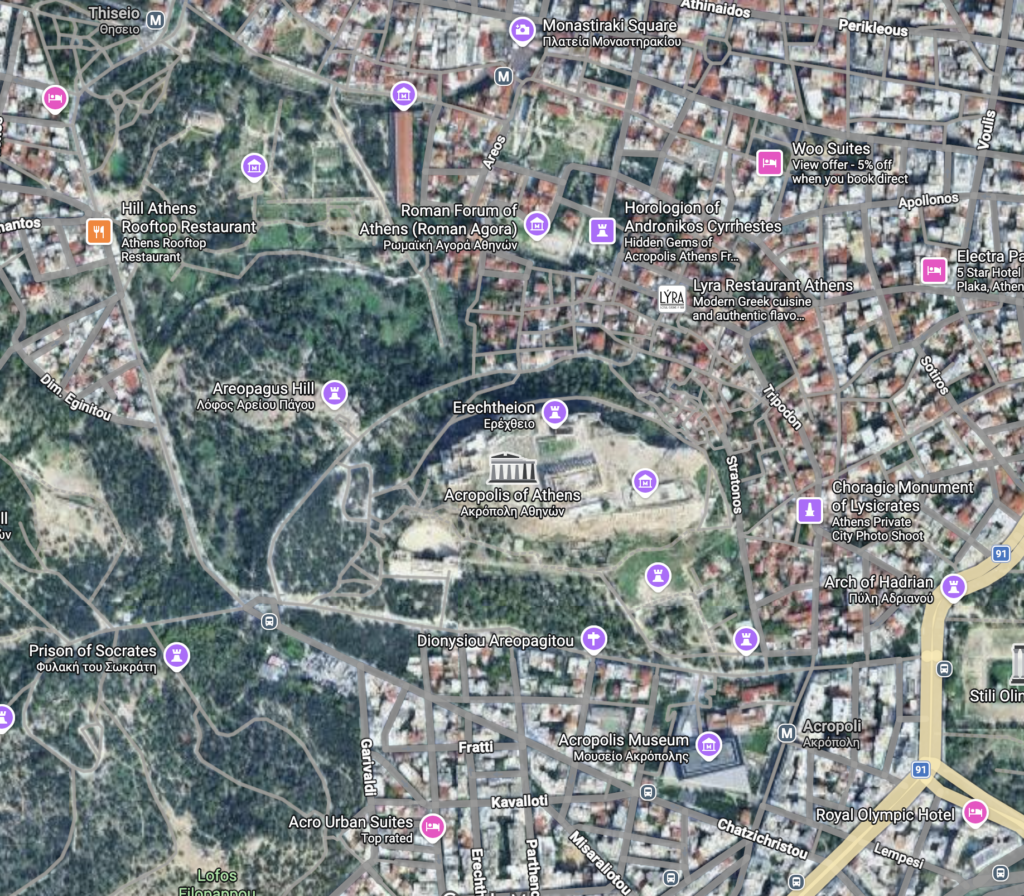
However, there isn’t much space within Google Maps to explain why someone should go to that place. While you can attach pictures and videos there isn’t much space for description. Your pins will also show on the map next to local businesses and sites of interest, distracting the user.
Google Maps will take you on a journey, but only literally. If your project has a physical space, Google Maps will be crucial for getting people there but it might not give them a reason to go. If your project requires navigational tools, we recommend linking out to Google Maps (or a different navigational tool) but keeping your more in-depth content elsewhere.
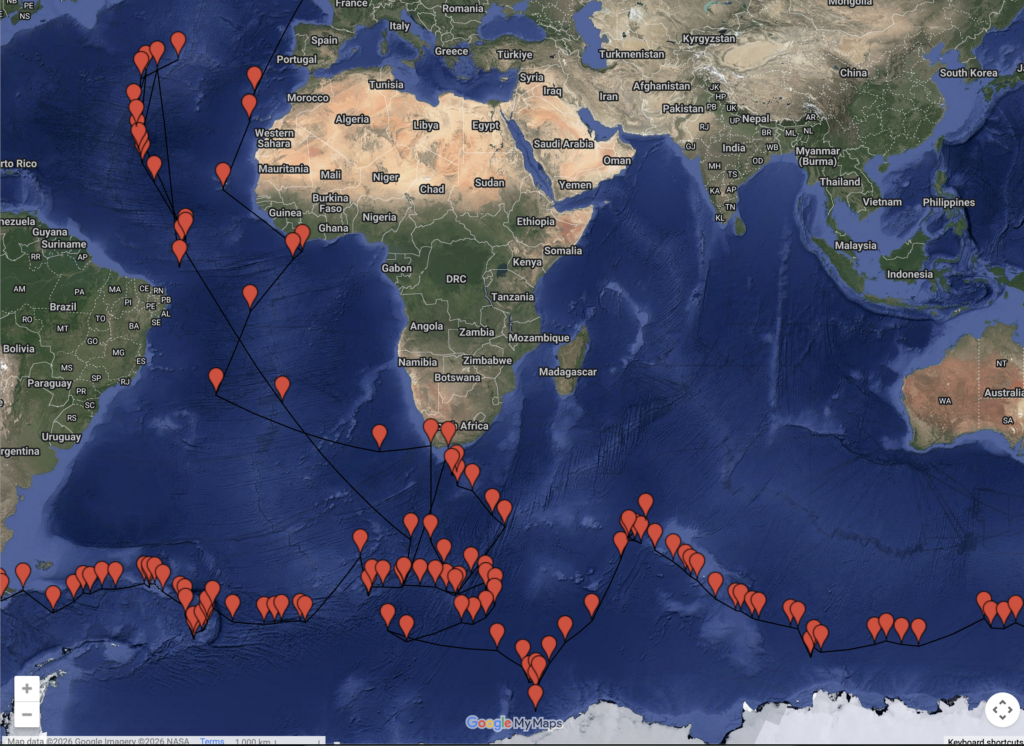
Google My Maps:
The next step up from Google Maps is Google My Maps, which is an extremely simple way of creating an interactive map. It has a very basic interface that’s easy to use but doesn’t offer much in the way of customisability or features.
It’s also free. If your project involves data but not much media, or if the map you’re building is complementing a project but isn’t the main attraction, Google My Maps is an easy and budget-friendly solution.
Because it’s hosted by Google and doesn’t involve many variables, your map is likely to last as long as you want it to.
This map of Captain Cook’s Second Voyage and this map of slavery in Detroit both use this platform.
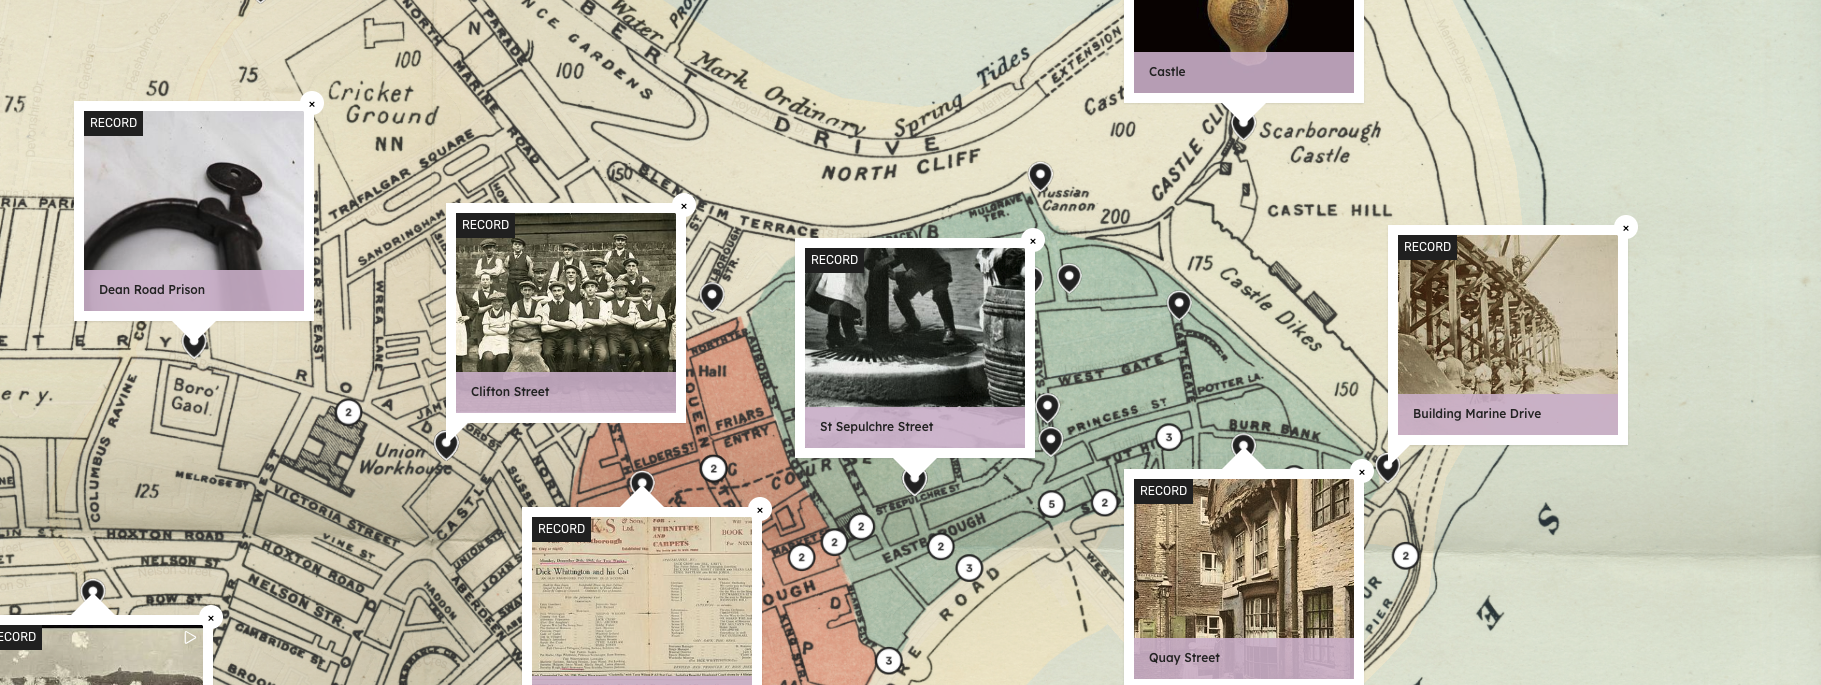
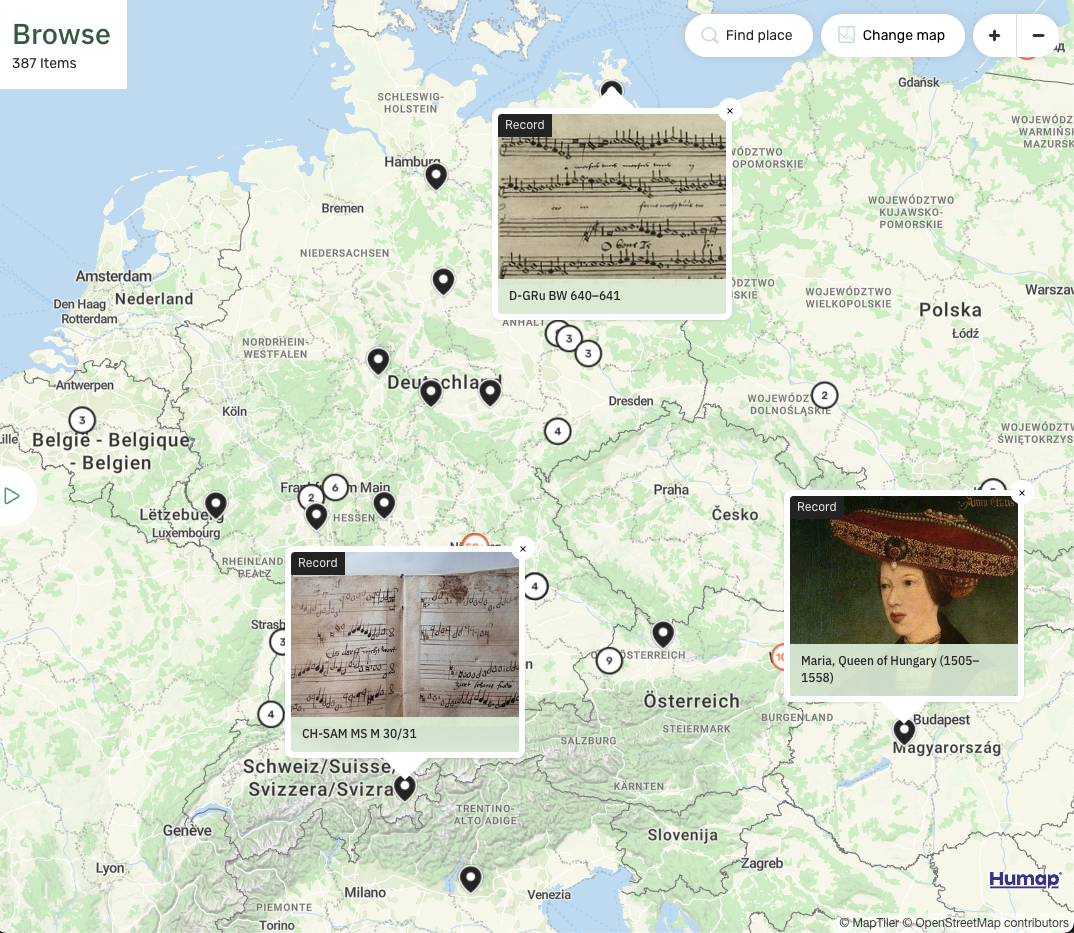
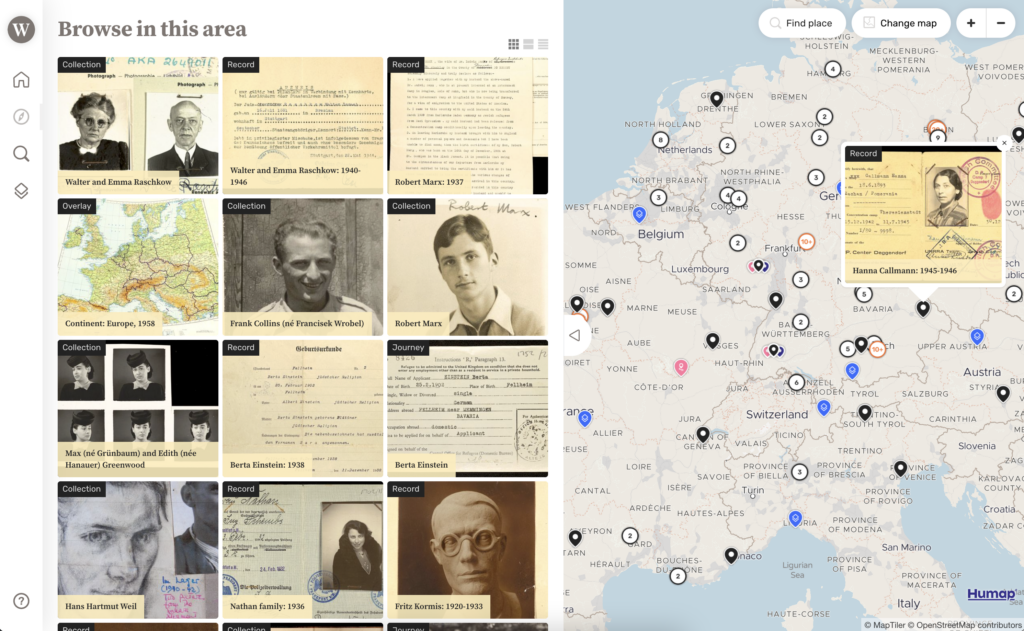
Humap
Humap is a platform we built with and for the humanities. Projects can be on any scale from local to global.
We support historical map and data overlays. We also have a crowdsourcing feature that allows your users to create their own content. We also support all major types of media, including IIIF and 3D models.
We like to differentiate between ‘location’ and ‘place.’ The location is where something happened, but the place is the event/person/object/anything that makes it worth mapping.
Abbey Road is a location in London. The thing that makes it a place worth visiting and mapping are the stories that have unfolded there.
Humap gives you a variety of different ways to reimagine them on a platform that’s built for sharing. You can create records, collections, galleries, trails, journeys, timelines and webpages.
Humap doesn’t require any downloads, coding, knowledge of GIS, or a superfast computer.
Your map is also your own. No one else’s content can be published to it without your permission.
Take a look at some projects on Humap:
-
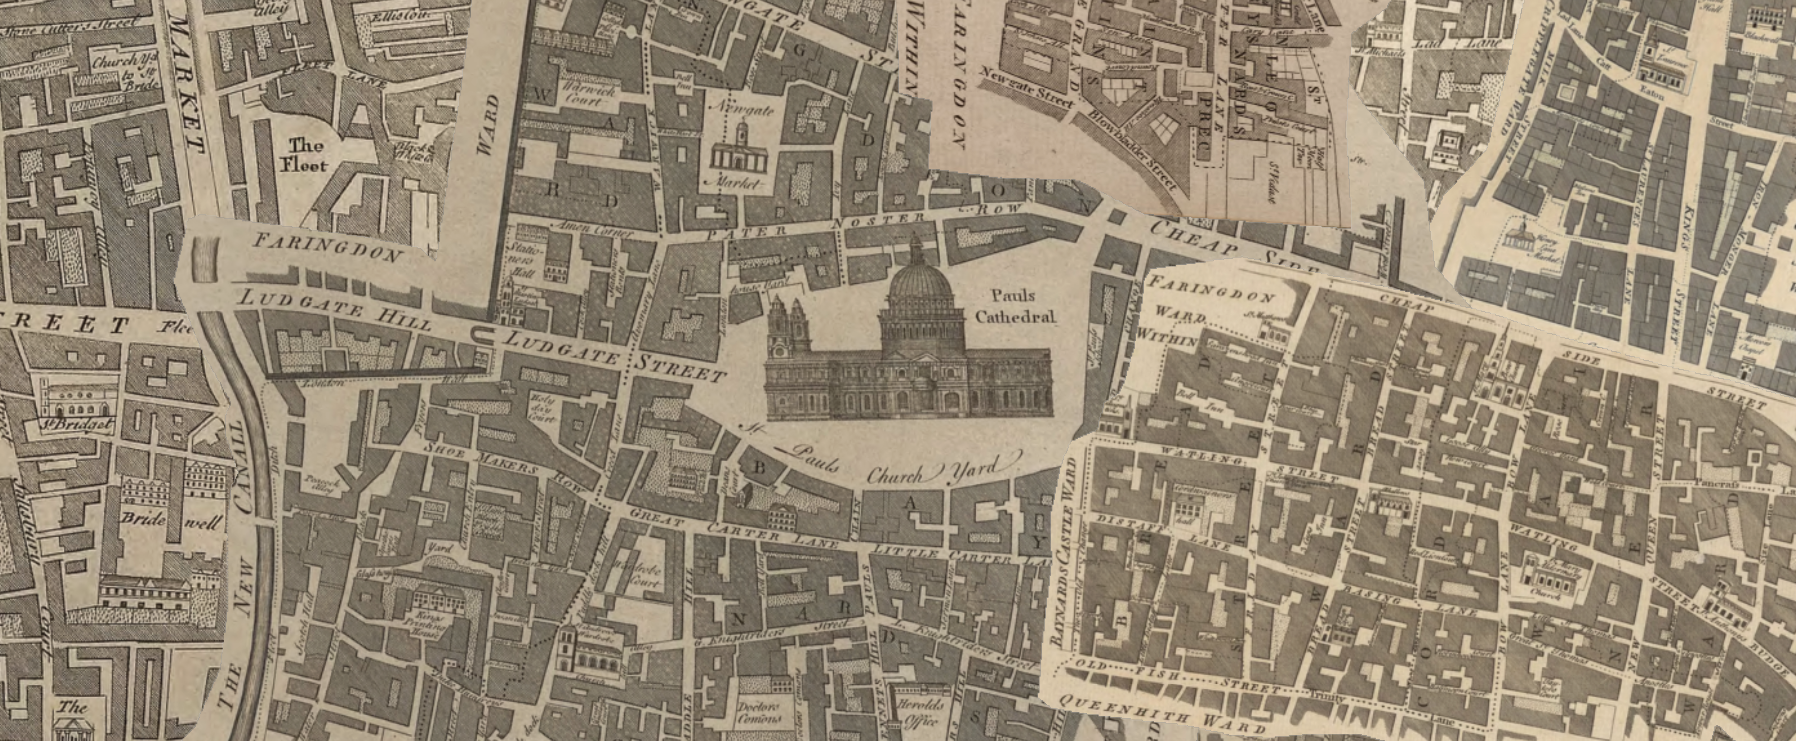
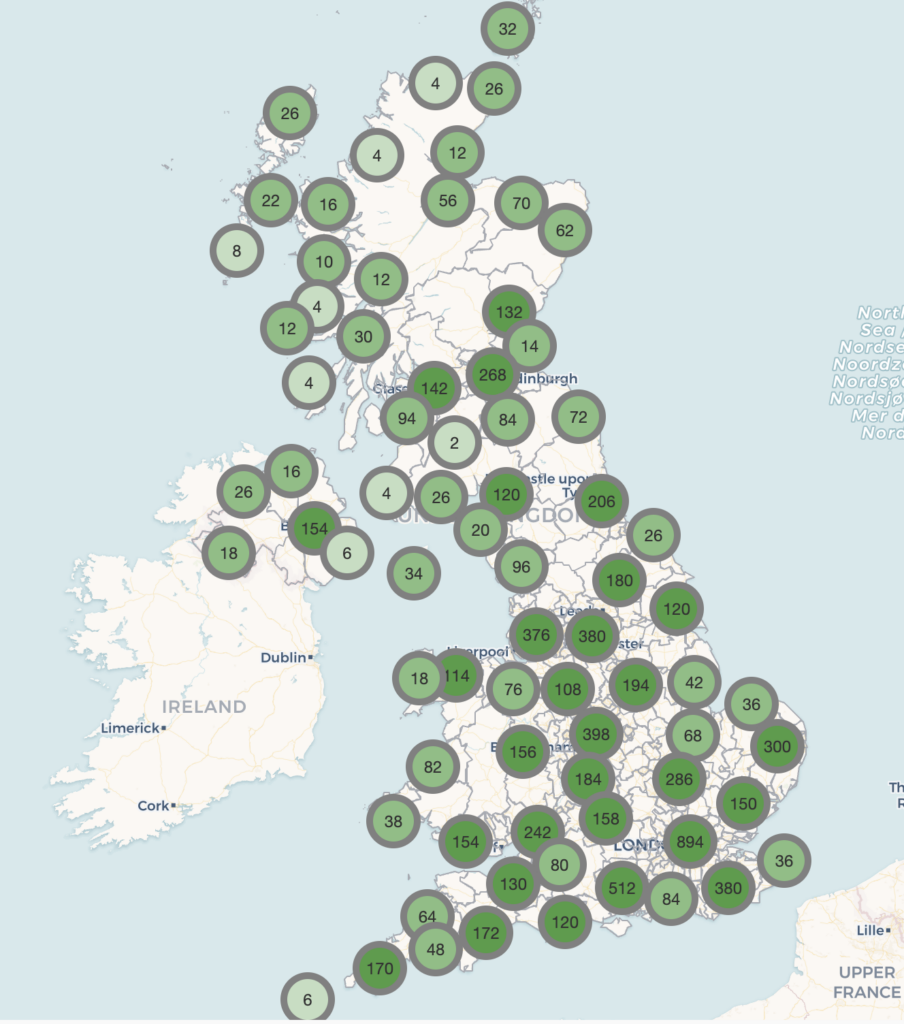
Charles Booth’s London (London School of Economics)
-
Tampa Through Time (University of South Florida)
-
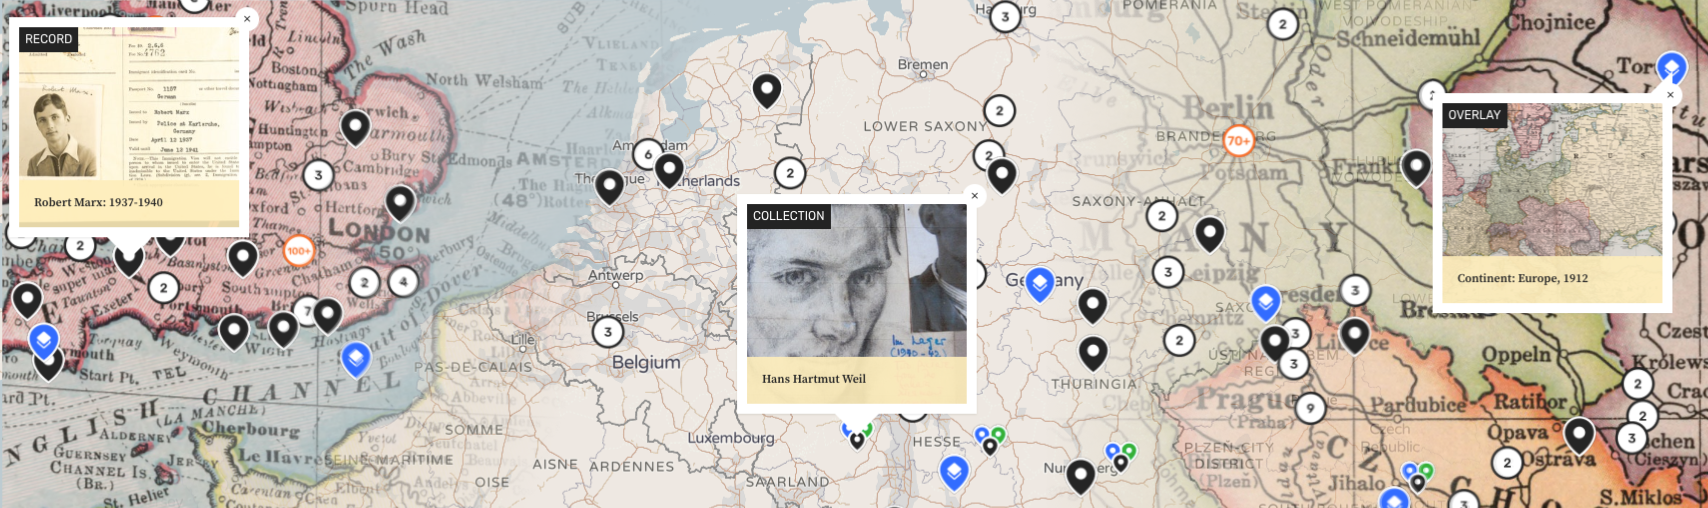
The Refugee Map (The Wiener Holocaust Library)
-
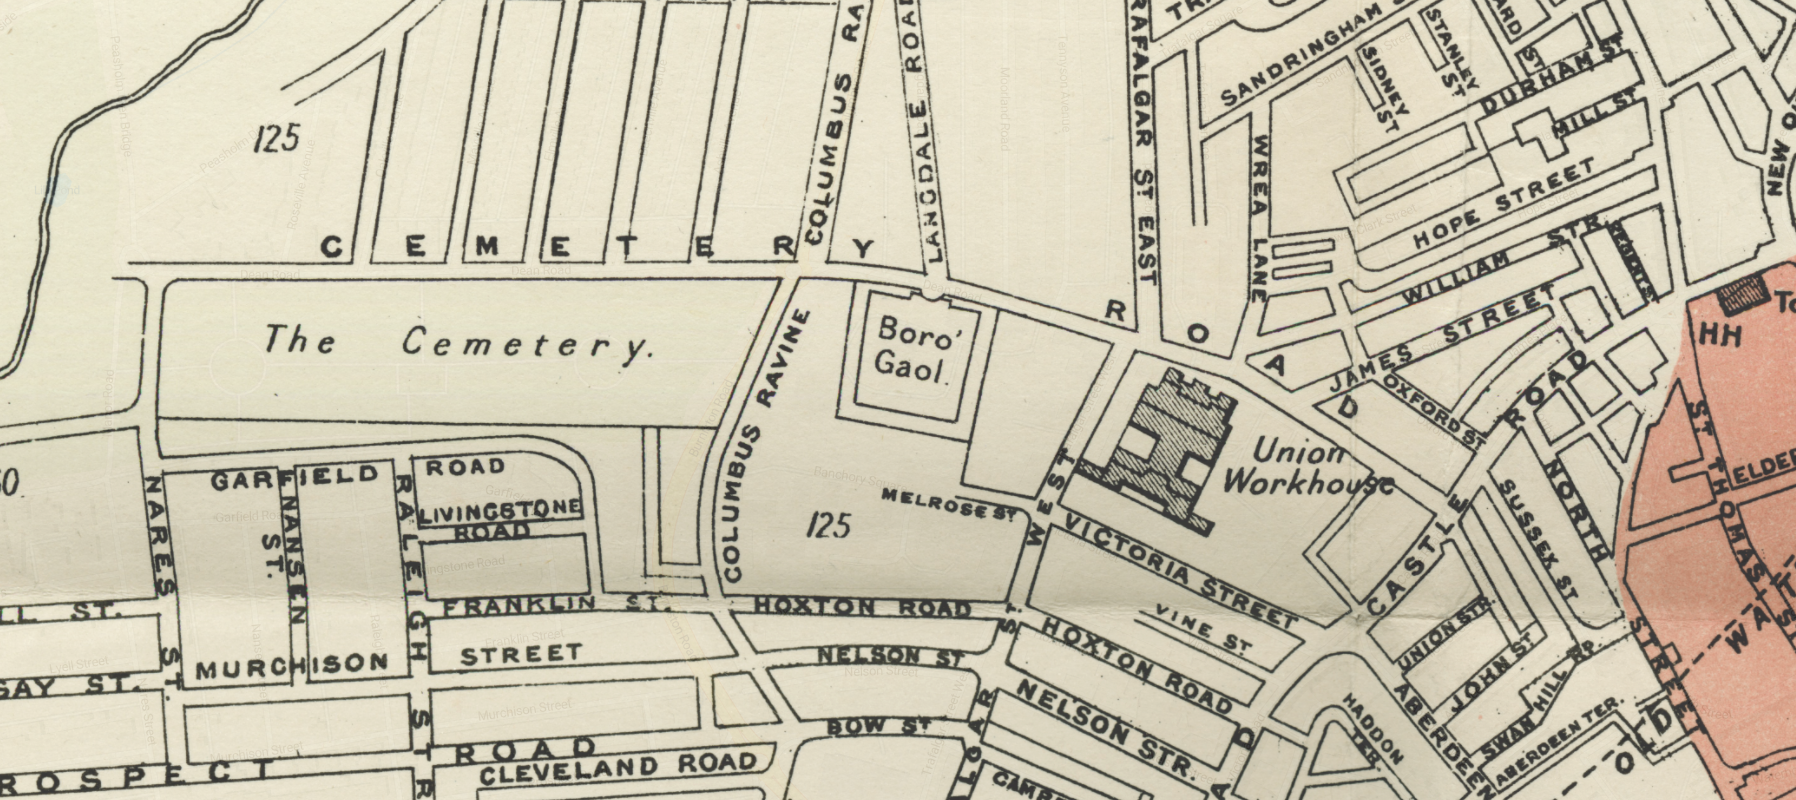
Layers of London (The Institute of Historical Research & partners)
- Learn more about Humap for cultural heritage
- We also have lots of case studies from our clients
Carto
Carto is a spatial intelligence company specialising in using location data to optimise growth for businesses. However, there are some interesting humanities projects on the platform.
Carto could work for you if you are mapping data that’s heavy on volume and light on content or media.
Carto isn’t trying to be a storytelling platform, but it can communicate a lot of data quickly, especially to an informed audience.
An example project on Carto:
Felt
We love Felt! It’s extremely easy to use and great for collaborating with other people. It can be used for pretty much anything and it’s got a huge range of features. Felt also has a fantastic user community to engage with.
Felt’s primary use cases are in utilities, exploration, and emergency planning, as well as town planning and individual journeys. The Felt team has also made a lot of data available which may be relevant to certain projects.
So, as you can imagine, it has lots of uses in the heritage space! If you’re visualising historical railroads or migration routes with more data than media, Felt could be right for you. It’s also extremely popular with citizen scientists and people interested in climate change and environmental disasters.
However, Felt isn’t designed to host galleries or multimedia content. If your project involves anything more complicated than images or data this may not be the right platform.
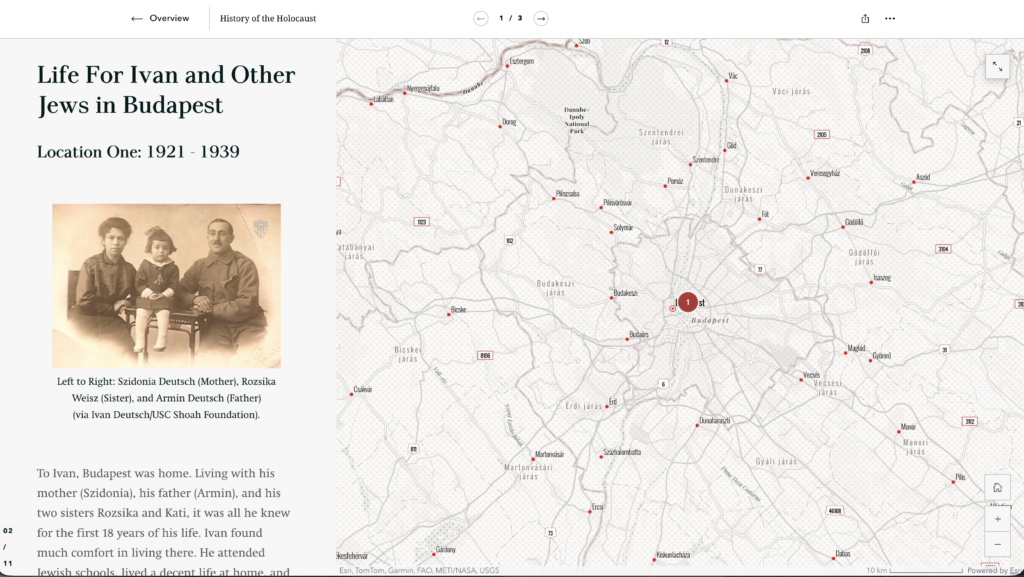
ESRI, ArcGIS & StoryMaps
The ESRI’s suite of tools is huge, but we’re mainly focusing on ArcGIS and StoryMaps here. ArcGIS is their flagship spatial data product, and StoryMaps is their foray into qualitative storytelling.
Traditional ArcGIS can be used for humanities projects. For example, this map of African heritage and this map of deaths of enslaved Africans during the Middle Passage. It works as a tool for visualising borders, trade routes, migration and large volumes of data. The educational value of projects like these are clear, but they’re not necessarily aimed at an inclusive, non-academic audience in terms of user-experience or discoverability.
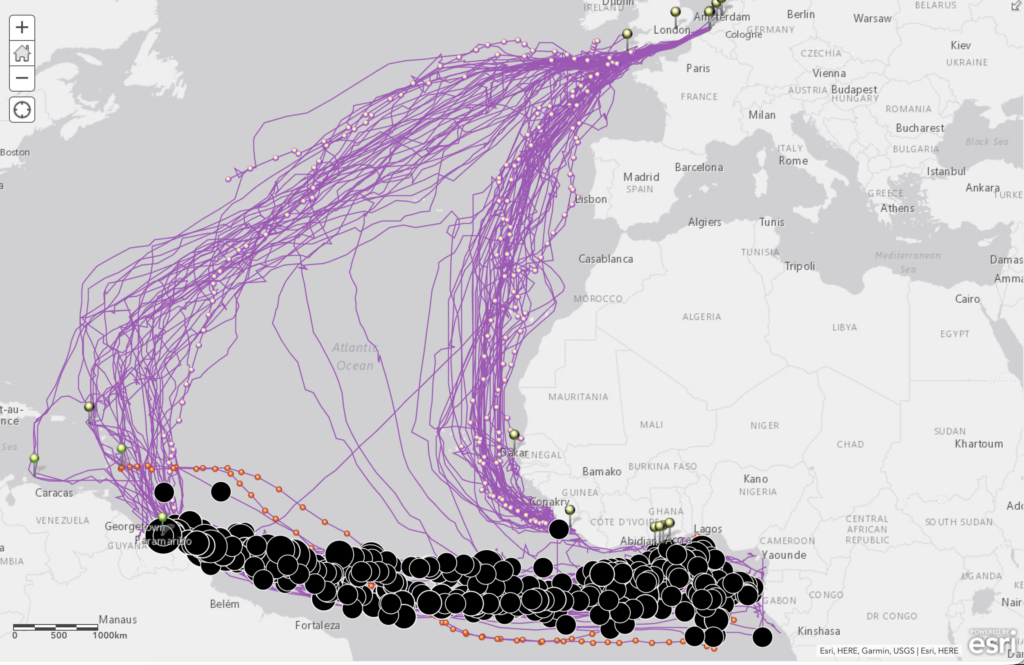
The key issue with ArcGIS is that the product was designed for spatial data. Learning the system takes a lot of practice. The platform wasn’t designed to tell stories online or educate the public as its primary operation. Because of this, non-GIS people have historically struggled with using it to create humanities-focused outputs.
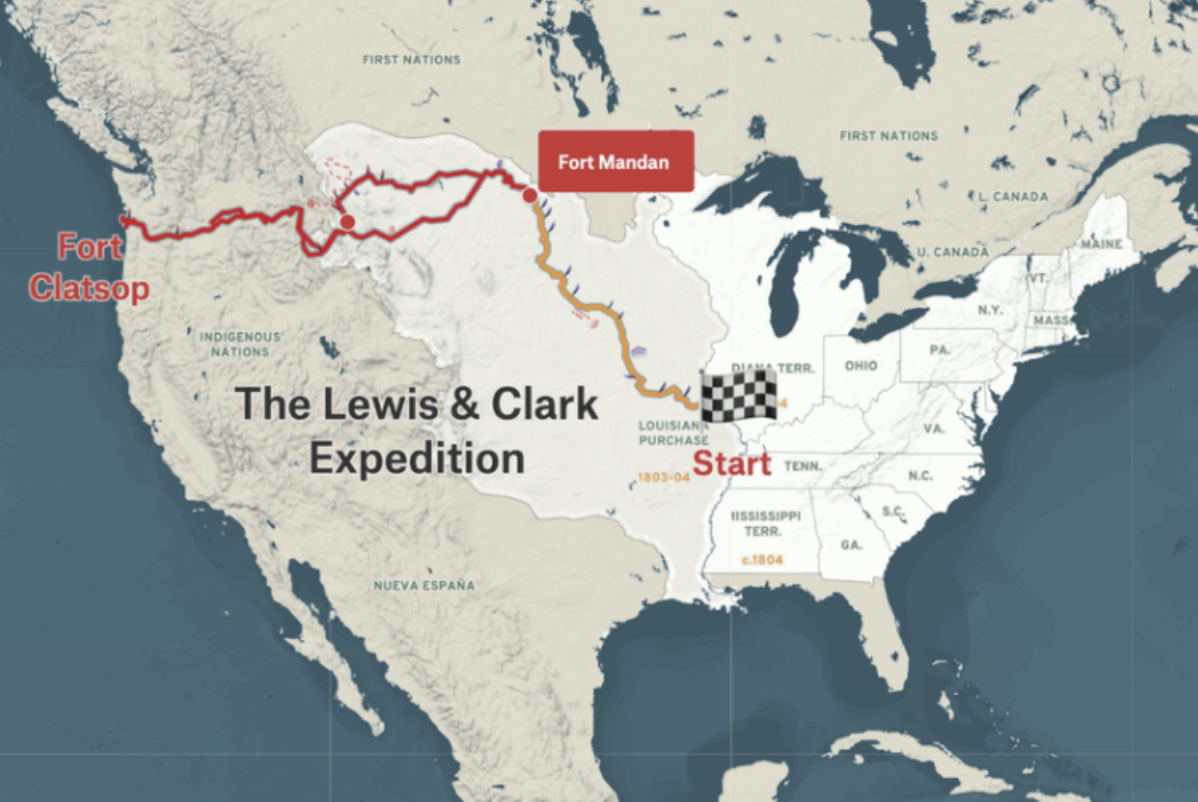
StoryMaps is significantly easier to use than ArcGIS and excellent for projects focusing on a single spatial narrative. As the storytelling on the platform is quite linear, the project team can create an extremely tightly curated experience for the end user that employs multiple types of media.
Alongside heritage projects, StoryMaps is popular with journalists and climate scientists as a way to make complicated spatial data more accessible to the layperson.
Examples of excellent StoryMaps projects include this project on histories of the Holocaust or the bombing missions of the Vietnam War.
Clio
Clio is free to use and has separate account types based on use case: standard contributor, college and university instructor, and institution administrator. Standard contributors can create and edit content, and their entries are moderated prior to publication.
College and university instructors can create and edit content with their students, and institution administrators can create and edit published content from their institution. The latter two tiers require verification before content can be created.
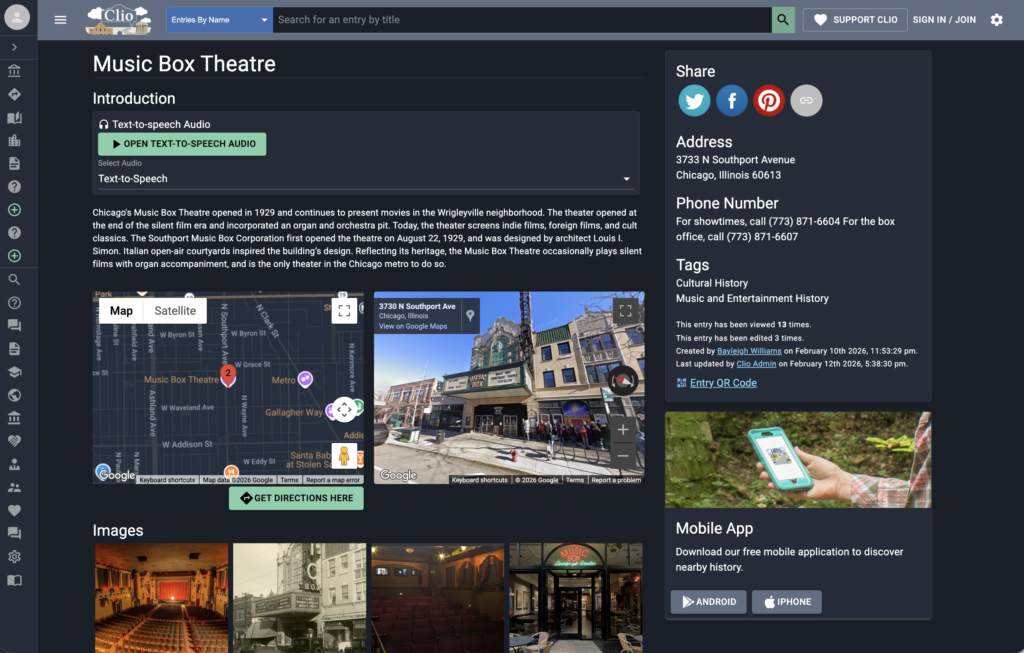
You can create pins which contain images, videos and text information, and you can also create walking tours. Google Streetview can be embedded within the entry, as can a text-to-audio widget.
The map is less front and centre than the information, but you can still find content via the map through clicking around.
Clio is full of beautiful, lovingly made collections that share the space together. As the items on Clio are moderated, they are reliably high quality and thorough. There is also an app, perfect for following one of Clio’s many tours.
Historypin
Historypin is a free map crowdsourcing tool, similar to Clio. Users can sign up and create pins, and institutions can create their own pages out of their collections. Users can add images, audio and videos and curate them into collections and walking tours. Google Streetview can also be used to compare images of a modern city with historical photographs.
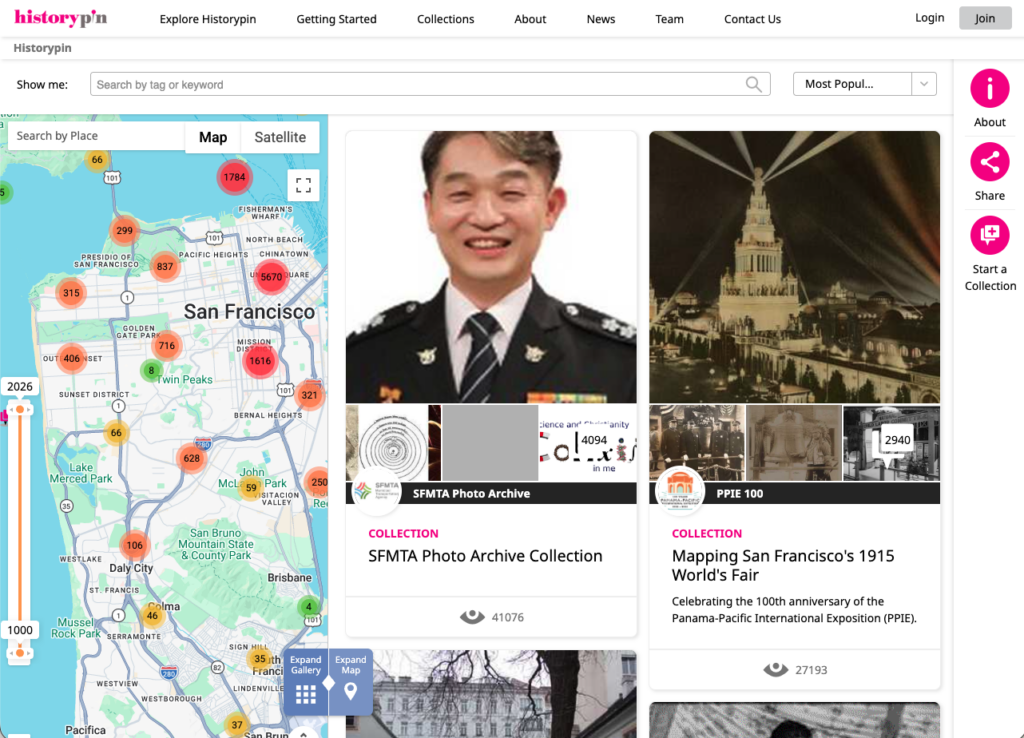
Members of the public can sign up and add content to Historypin, which is moderated by the user community.
Over 80,000 people and 3000 cultural organisations have created content on Historypin, and, similar to Layers, you can experience highly curated content in the same place as personal memories and reflections. As anyone can add to it, item quality can differ, but as a source of vernacular history and crowdsourced historical data it’s excellent.