Trusted by


Start mapping in minutes
 More features
Built for community, research, classroom, and archive projects
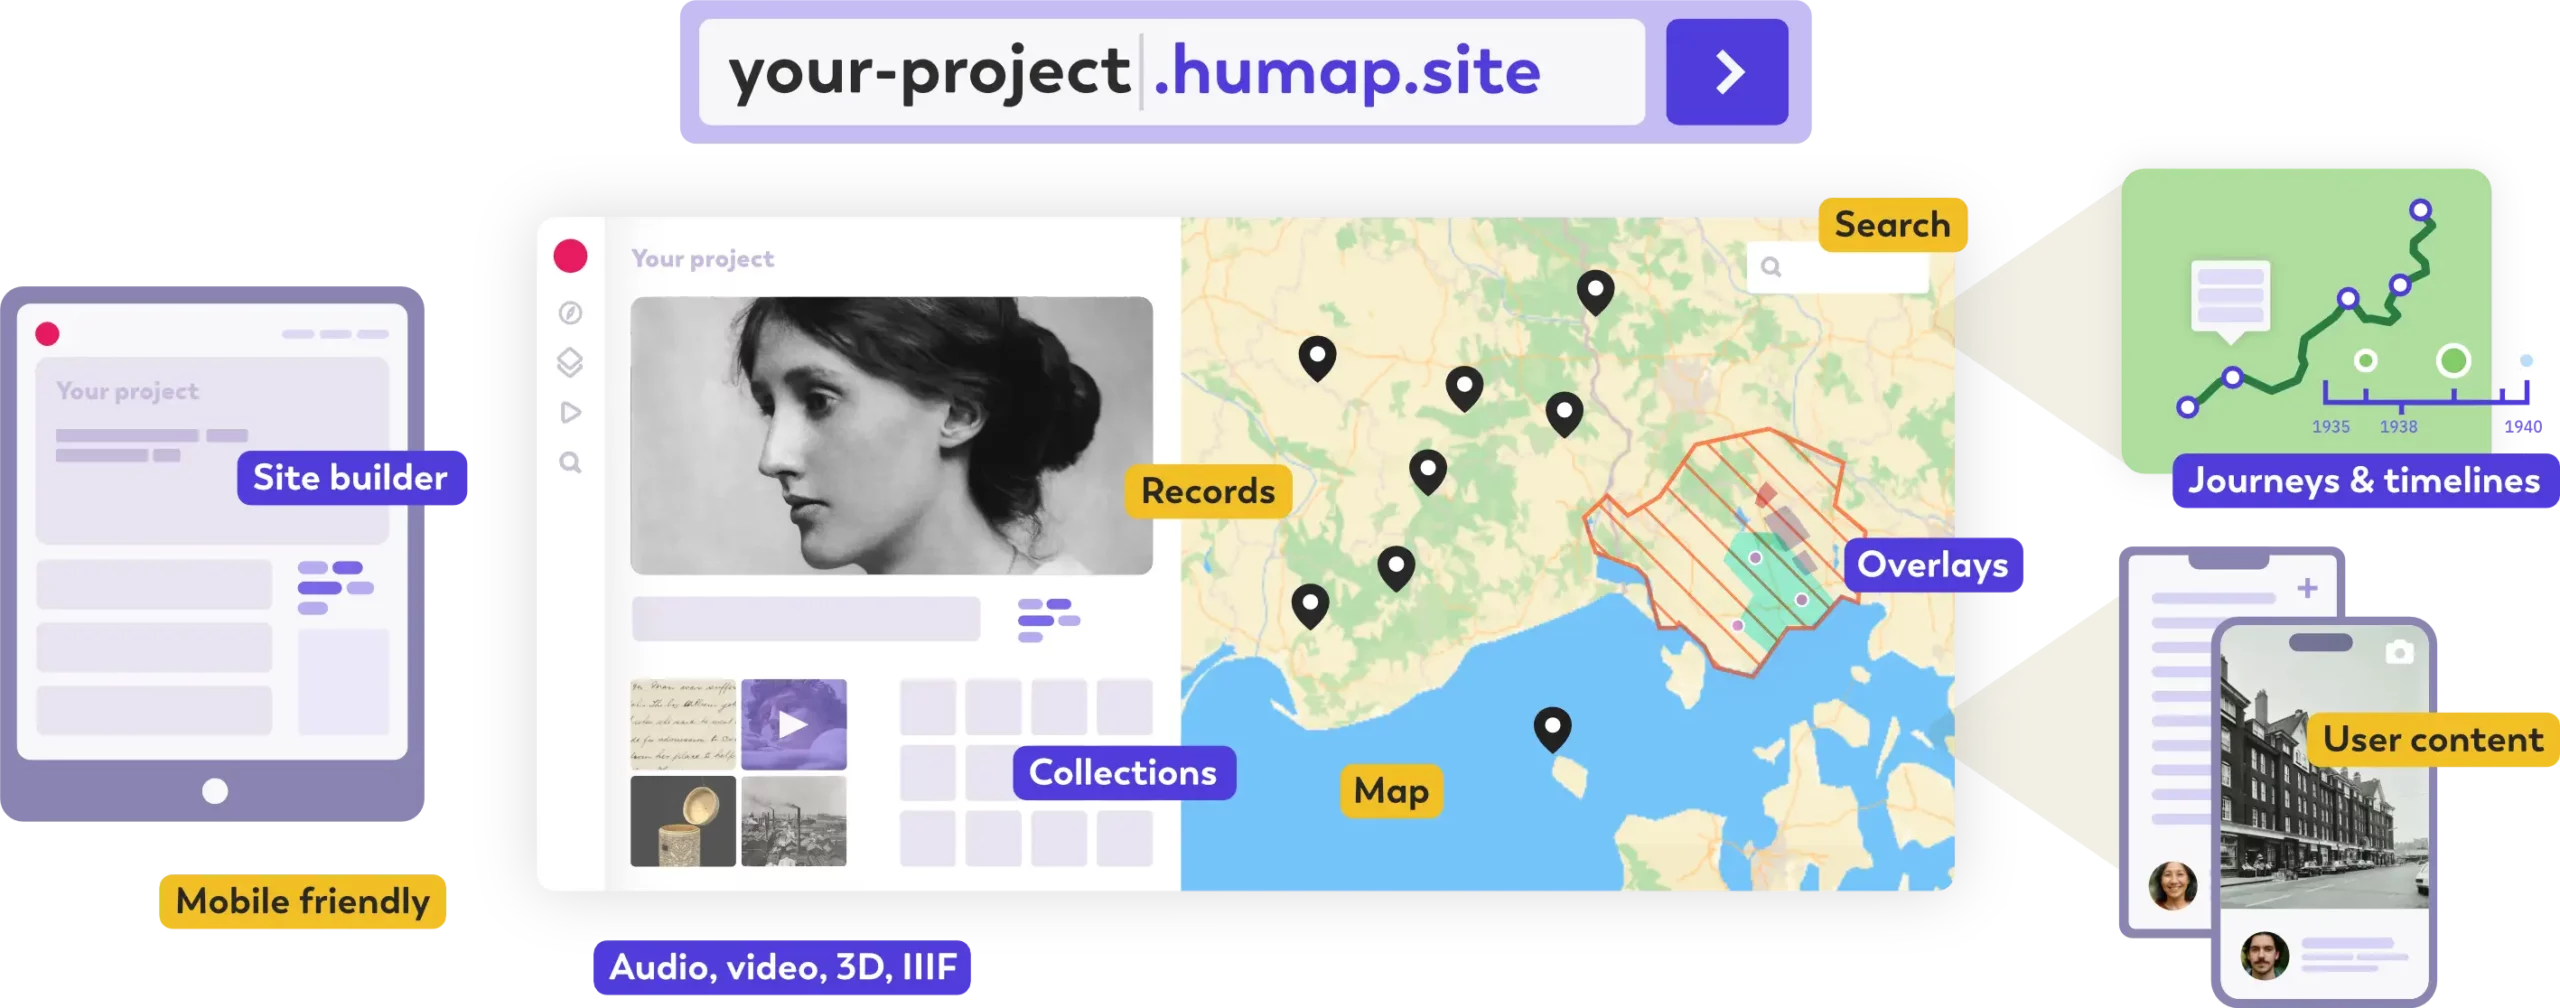
Start building right away
Creating a Humap website takes seconds. You can add content manually, or import data from a spreadsheet.
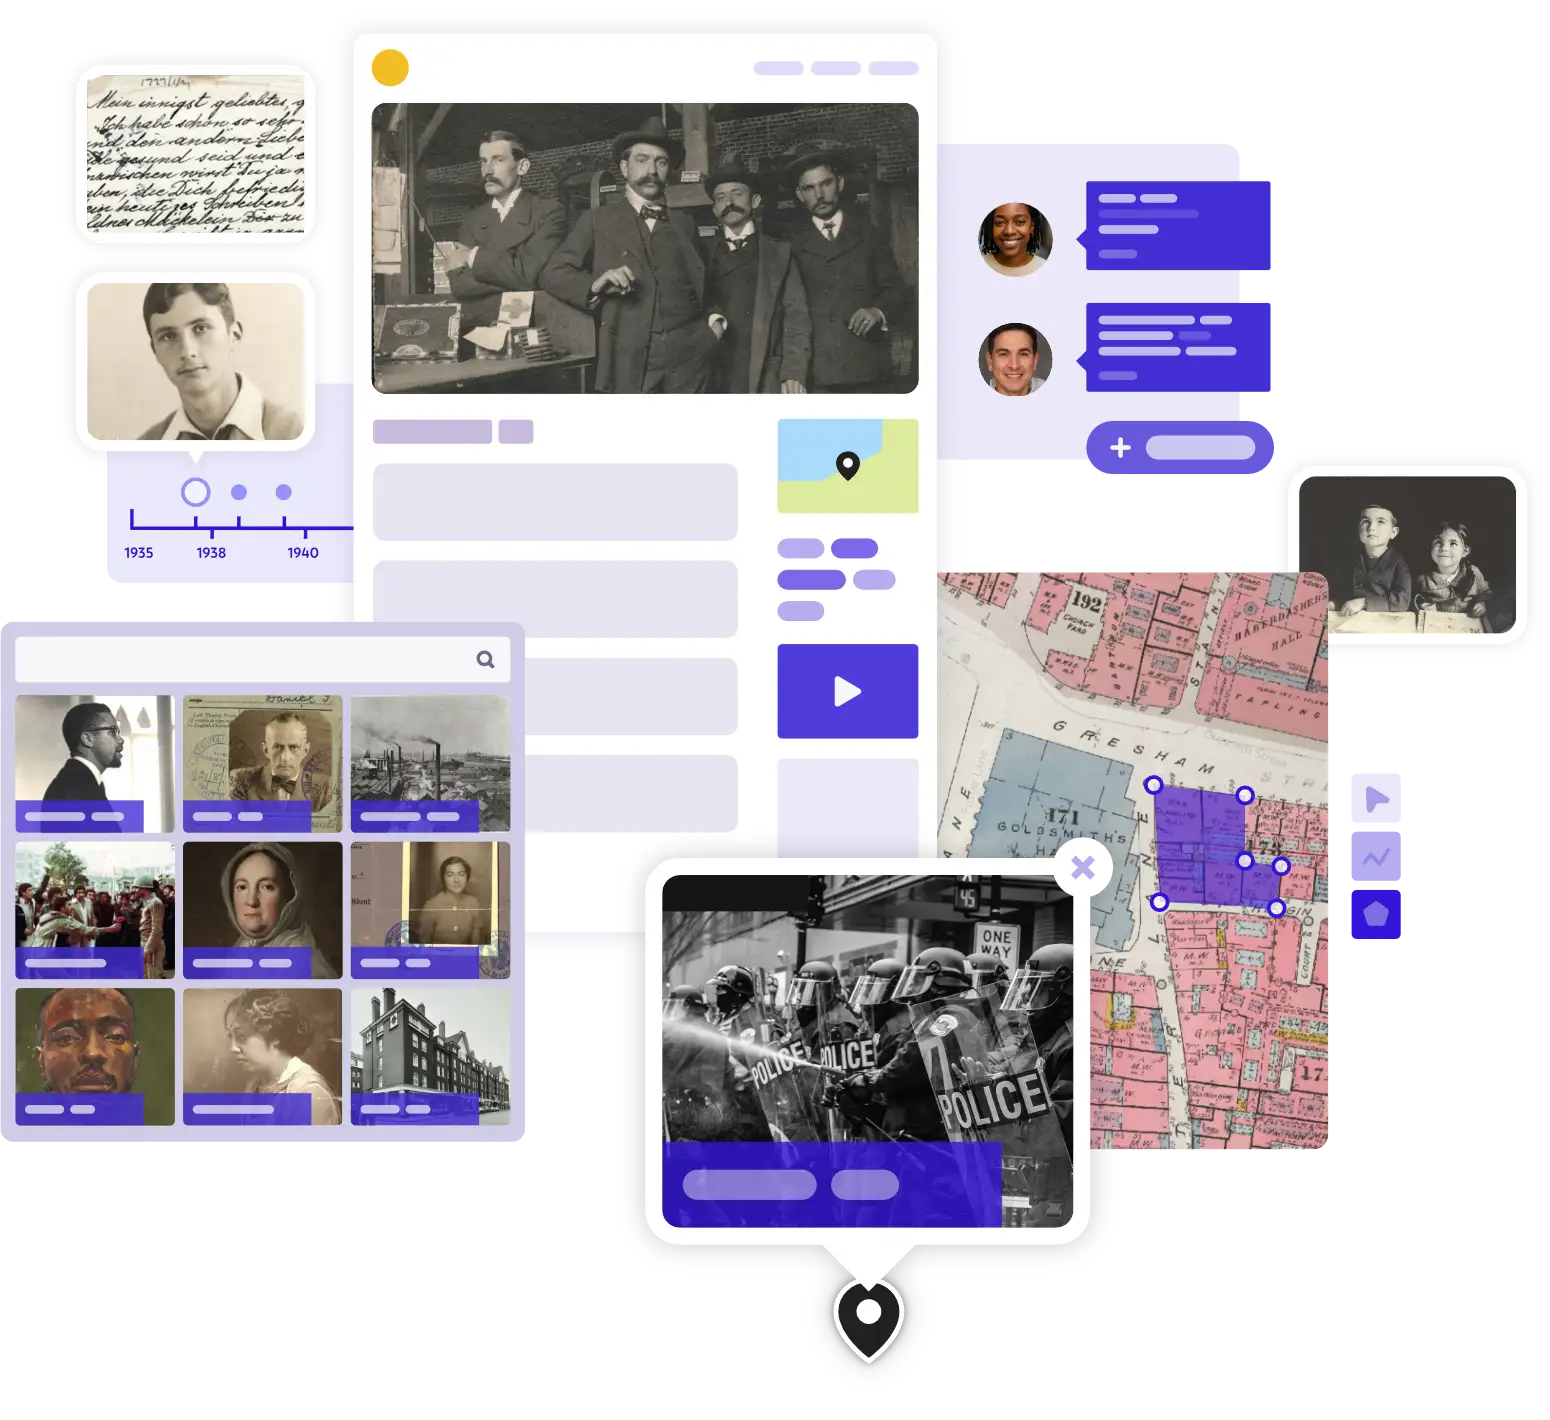
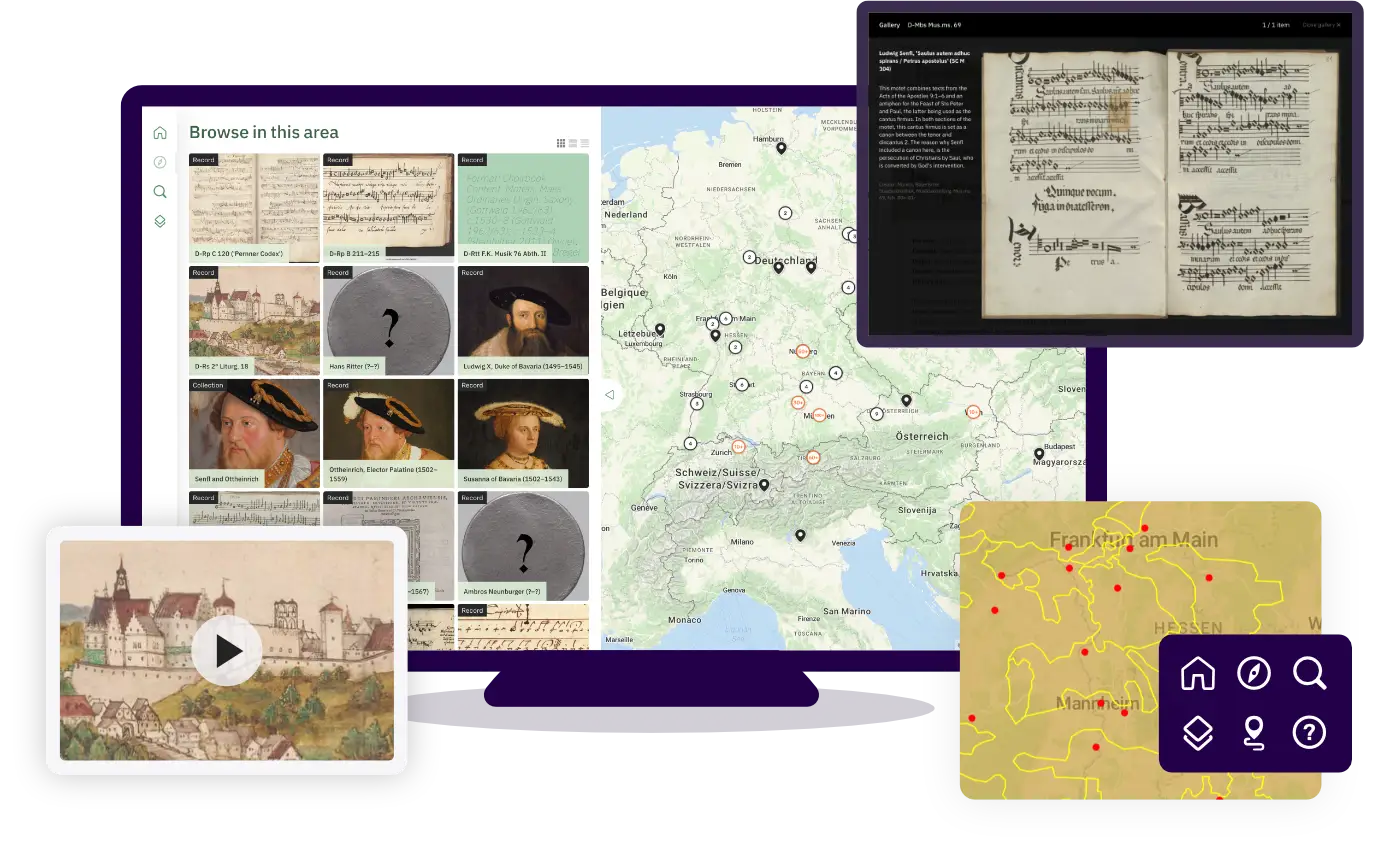
Map, publish, share
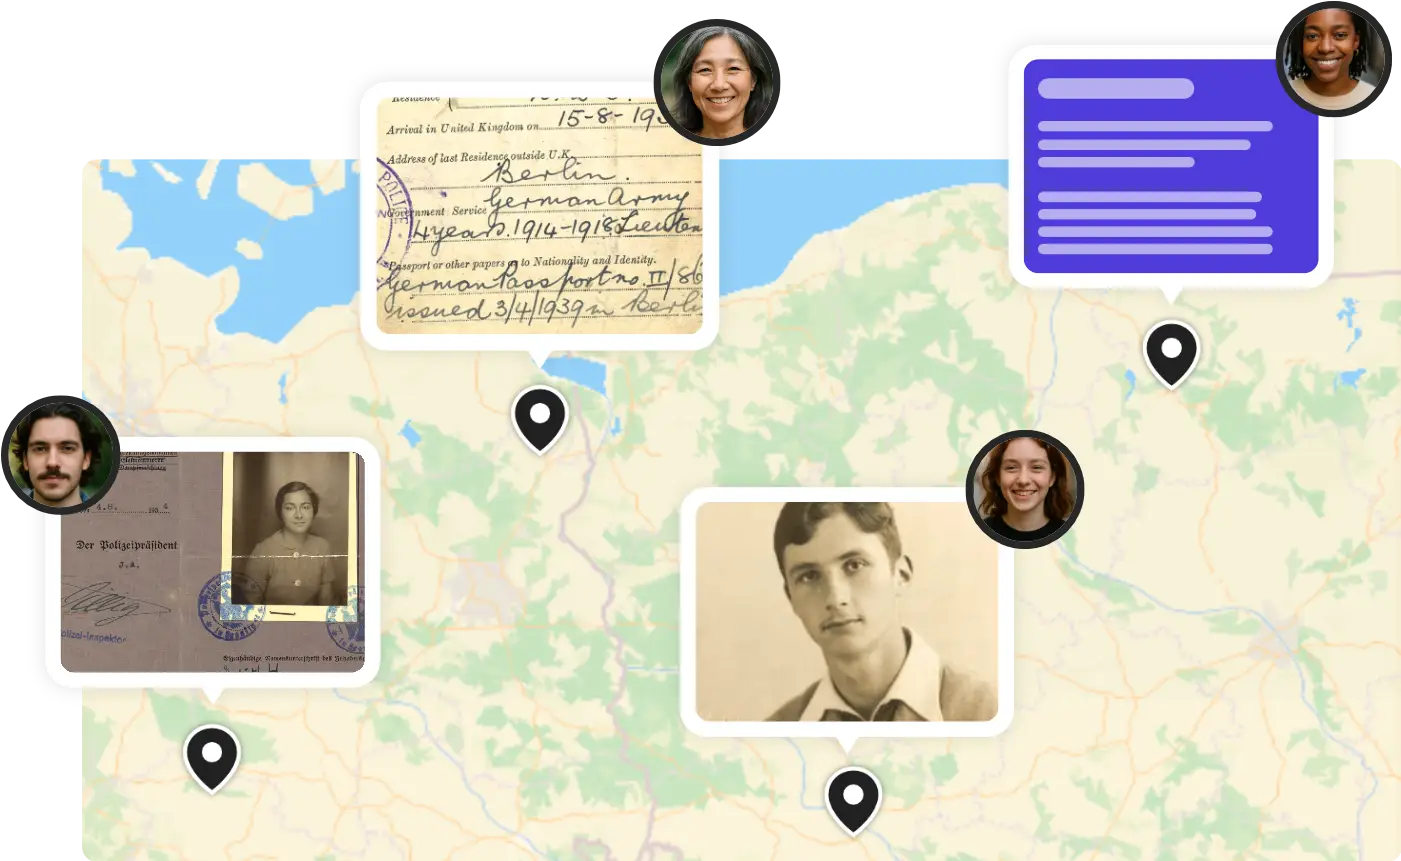
Increase engagement with your work by reimagining it as a multimedia, interactive experience.
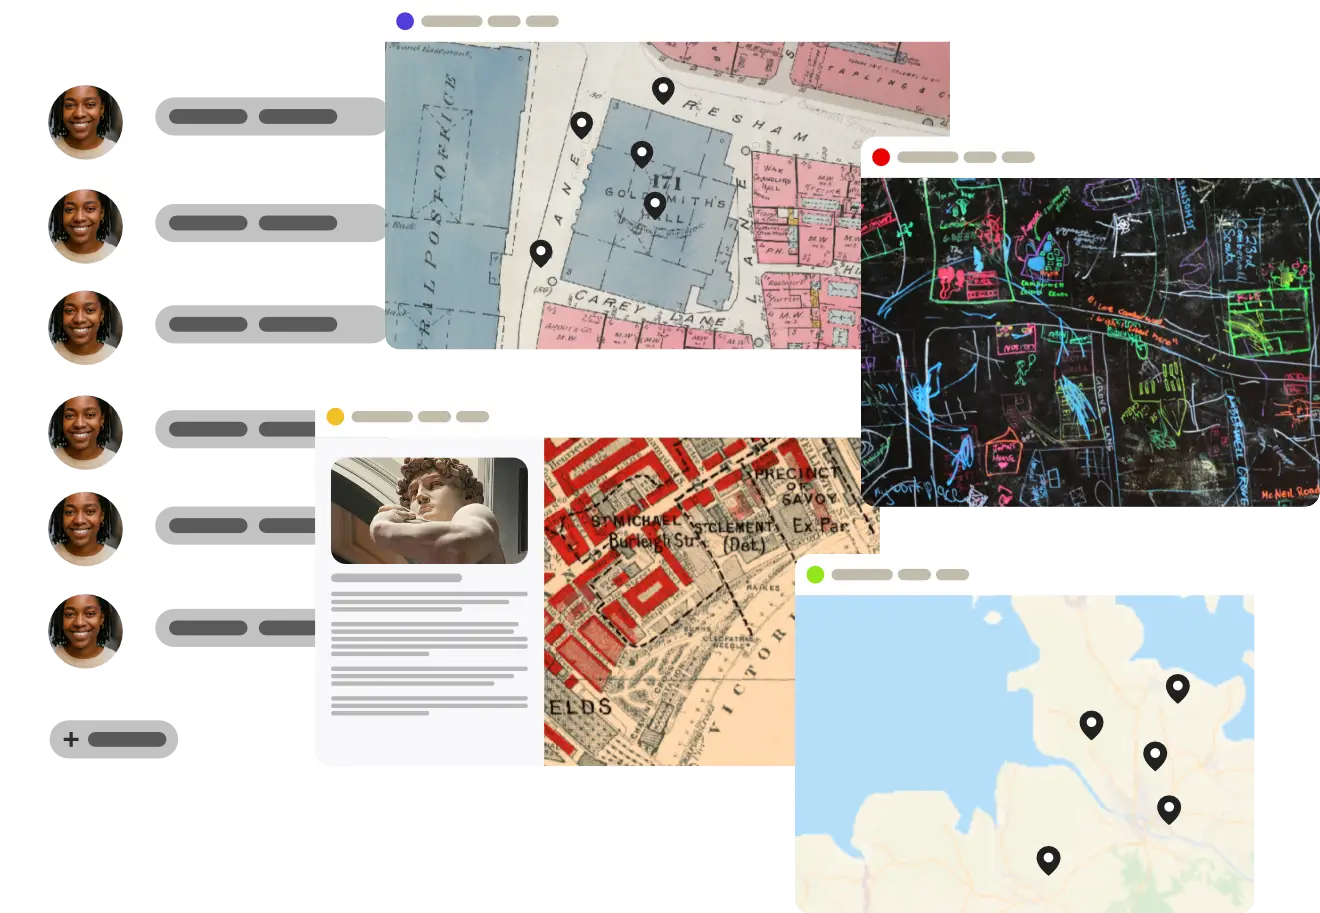
Crowdsourcing and collaboration
Invite the world - or just a few trusted partners - to contribute to your Humap.
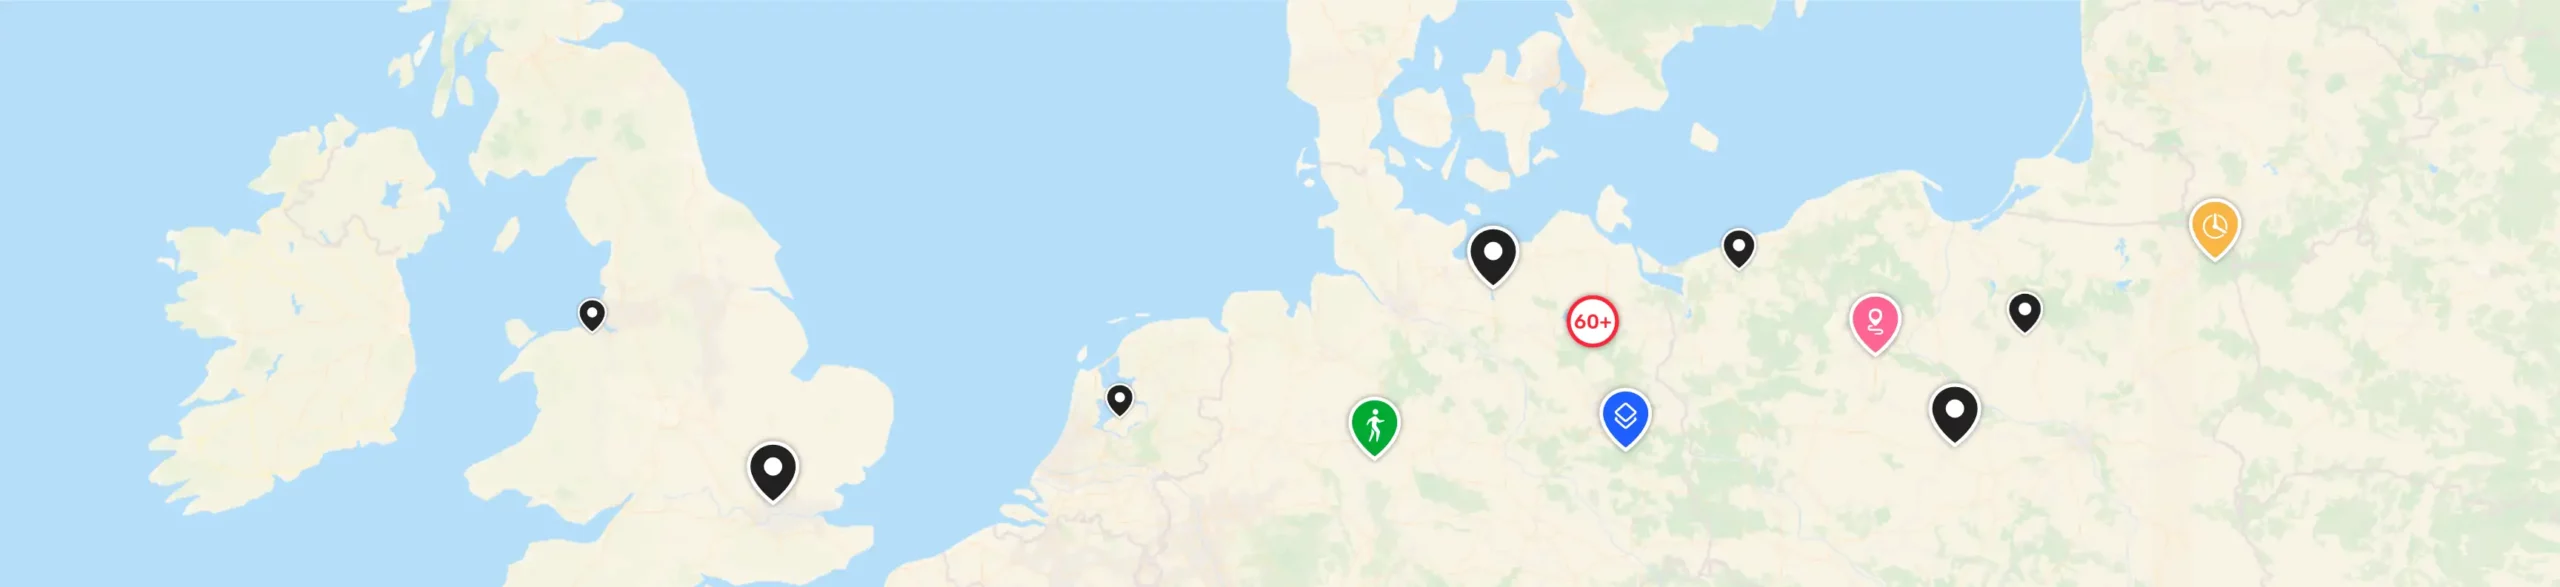
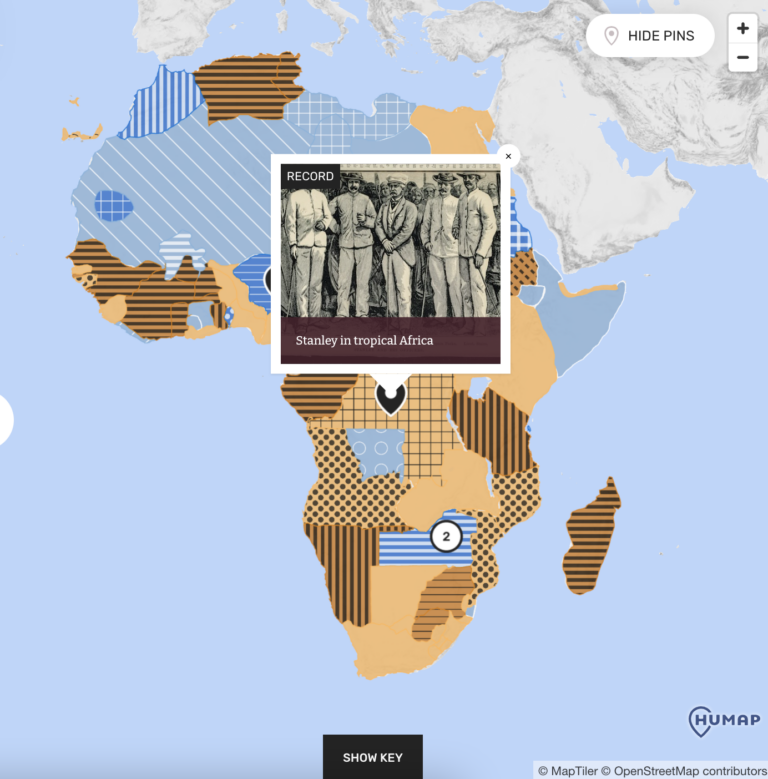
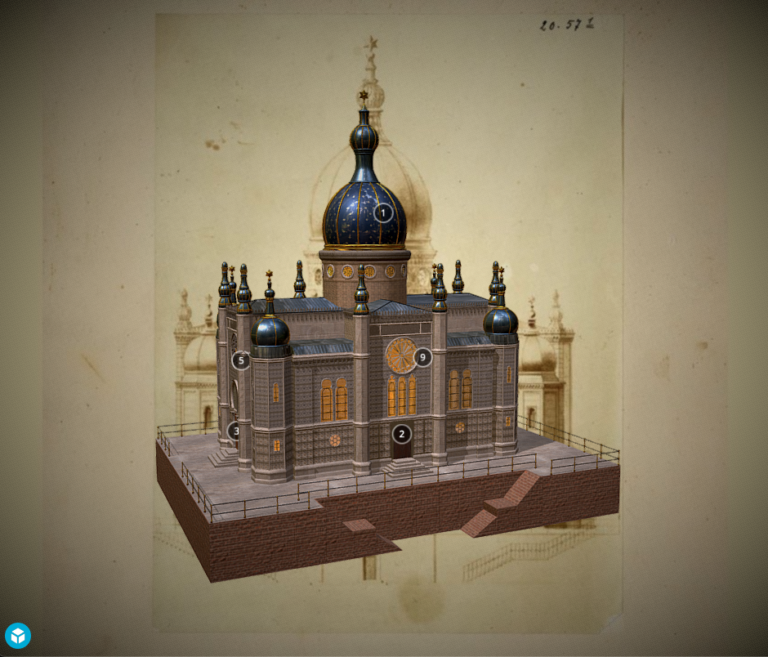
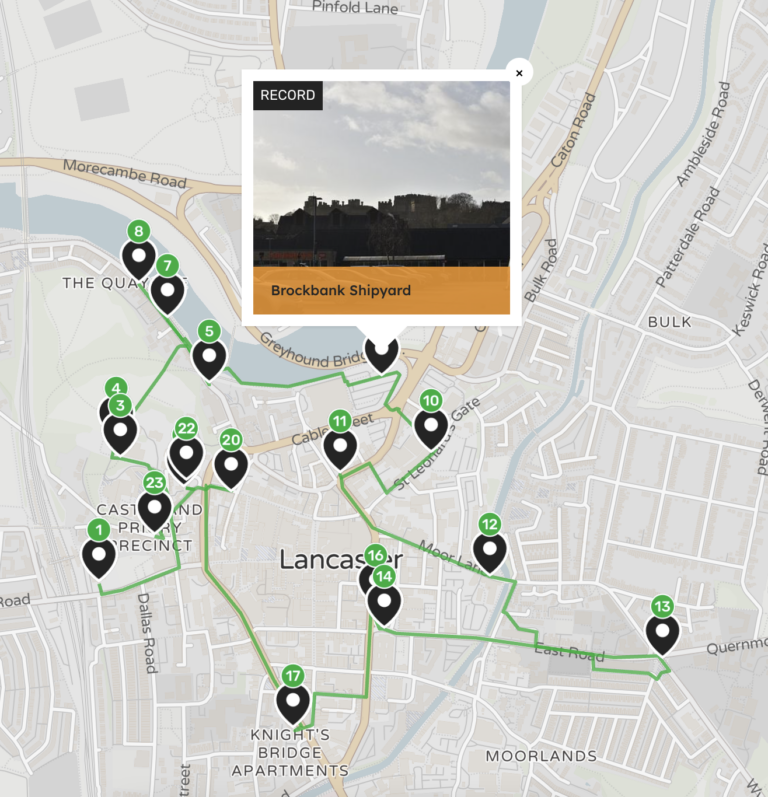
Humap in action
More projects
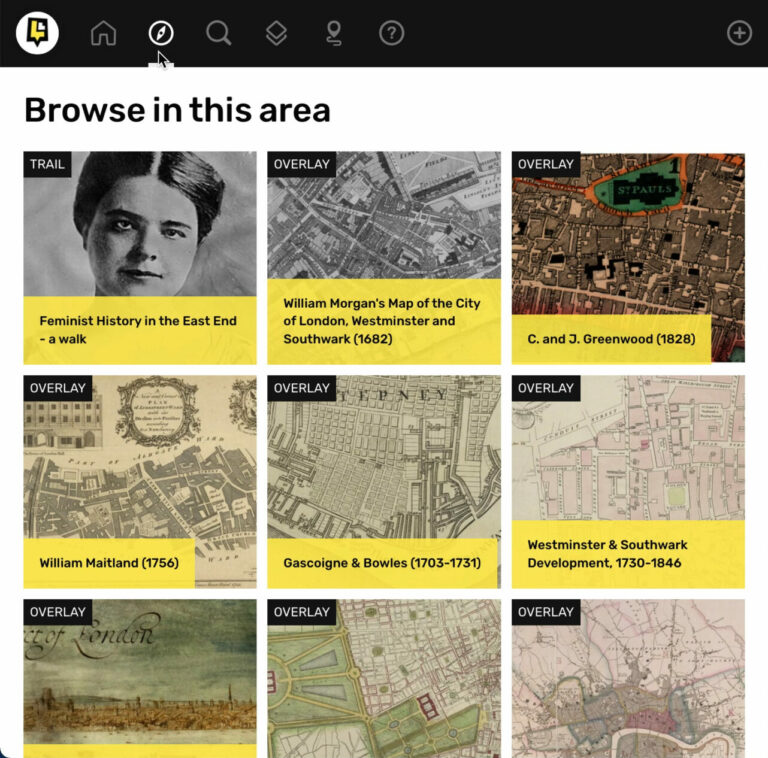
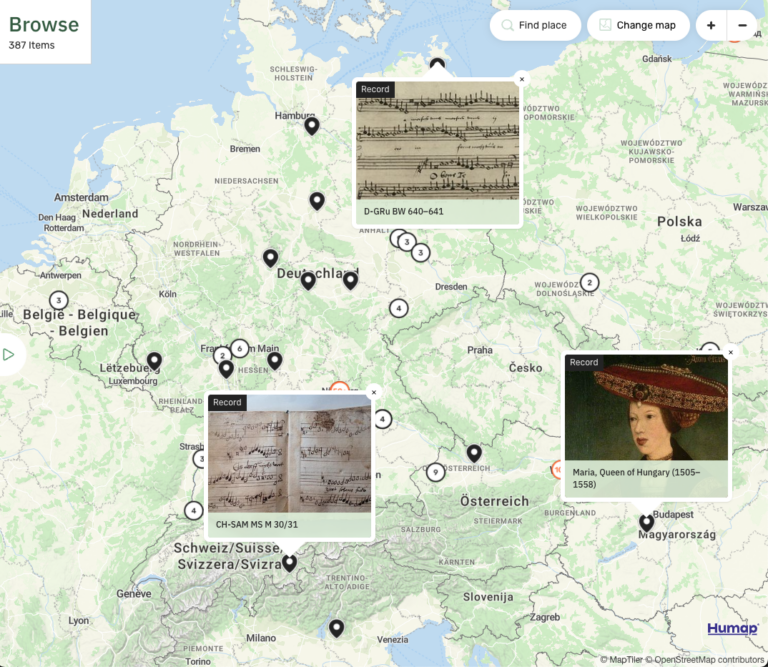
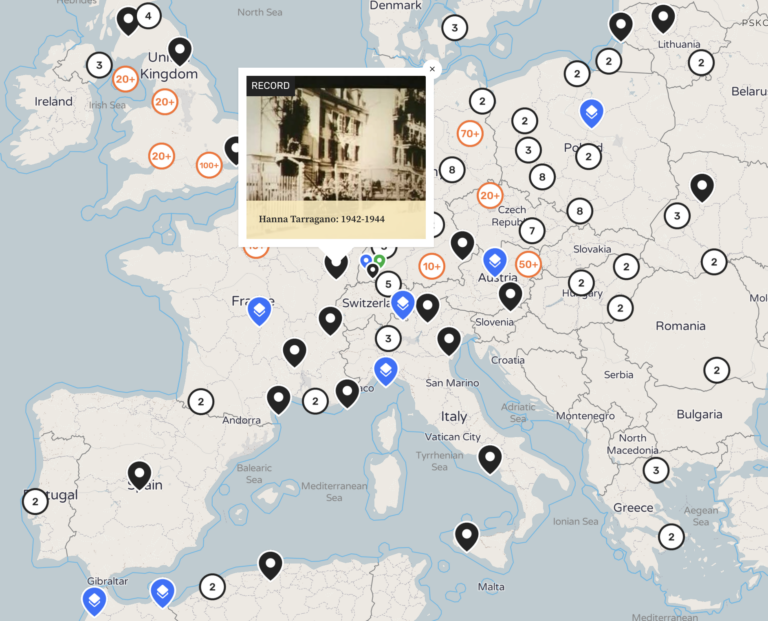
Stories designed to be shared
Browse story maps created by universities, museums and local communities.
A map platform anyone can use
Empower your community to tell their story
With Humap’s map crowdsourcing tools, anyone can get mapping in minutes - no GIS skills or training needed.
It’s built for classrooms, communities and collaboration.
For your team
Work together within one platform to create, educate, and inspire.
For your community
Invite your community to tell their story, their way. Humap is flexible and multimedia, perfect for complex stories.
For everyone
Gather data and insights from the entire world, excellent for citizen science and crowdsourcing projects.*
*moderation features included.
*moderation features included.
Trusted by
Use cases
For small organisations and community-led projects
A standalone map project with all the features you need
Create a full-featured interactive map with your chosen features.
Perfect for community, cultural or research projects.
Huge suite of features to choose from
Walking trails, journeys, timelines, and more! Choose the features which work best for your project.
Include us in your grant-writing process from the start
Our Funding Bid Kit has everything you need for your grant application.
For the Global South and those fighting a good cause
Operating in the Global South, or a non-profit trying to make the world a kinder place? Contact us to discuss a discount.
For institutions
Unlimited projects for your students and researchers
Our digital humanities map platform supports academic research, classroom teaching, special collections, civic engagement and collaboration with ease.
Institutional licenses
Unlimited maps and users, and access to all of our features.
Manage users & SSO
Create and manage users and permissions easily.
Legacy mode
Keep projects online after the funding has ran out.