What is a story map?
Maps have always told stories. They define where we are, who we are, and how we think about ourselves.
They can communicate all of this at a glance, making them powerful tools for communication and education.
Story maps take data and make it tangible. They make abstract ideas feel real and reveal new insights.
The tricky question is often where to start. In this blog, I’ll examine several projects created by our clients and discuss the different ways they create and curate their story maps. Hopefully, this will be useful to anyone embarking on a story mapping project, regardless of platform.
Looking for inspiration? Check out our spatial storytelling resources page.
The Refugee Map
The Wiener Holocaust Library is the oldest dedicated institution to storing archival materials relating to the Holocaust in the world. Their collections contain over a million items.
Their collections database is excellent for academics and dedicated historians. The Library, however, wanted to create a more accessible online space for the general public. Many of the documents and entries relate to specific places, and the exhibition focuses on stories of migration. Mapping the items brought these stories together.
Their original version of the map launched in 2015, but it didn’t get the number of hits the Library was hoping for. In 2021, with support from Arts Council England, they launched the new Refugee Map on Humap.
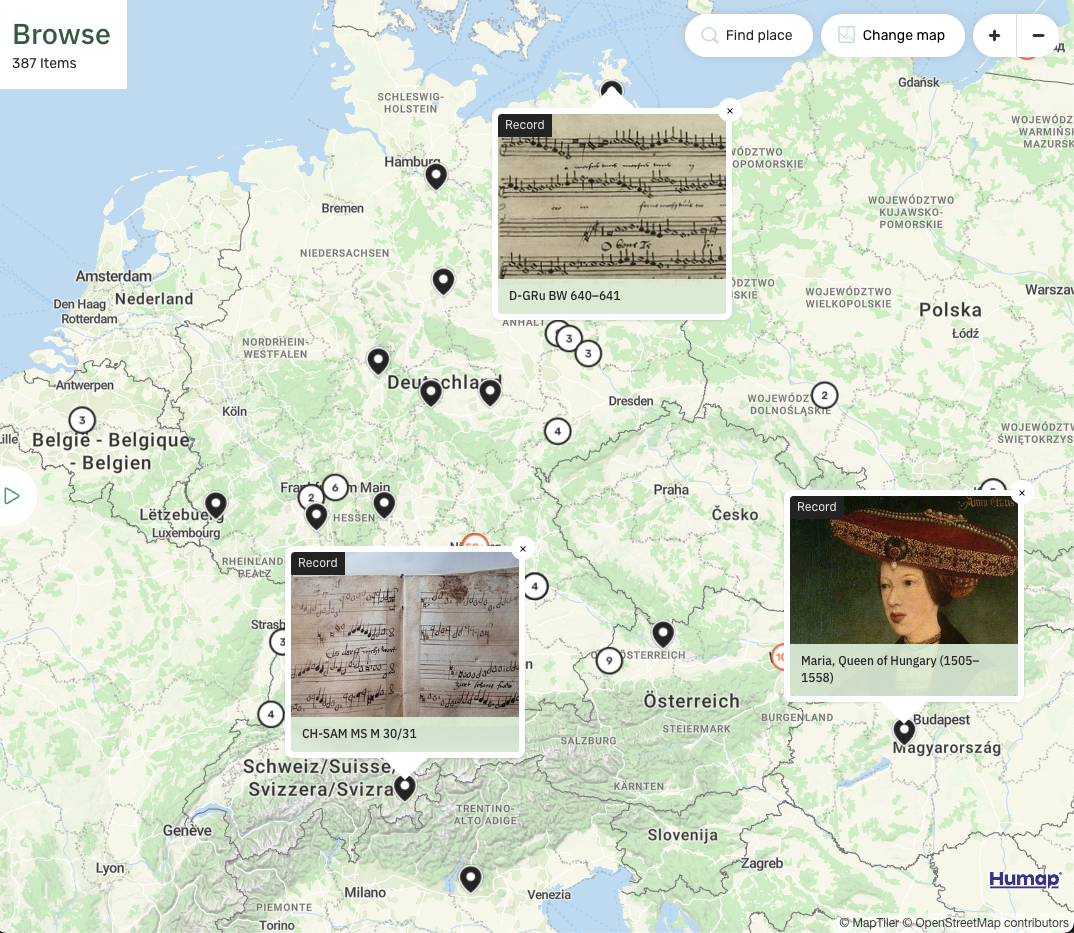
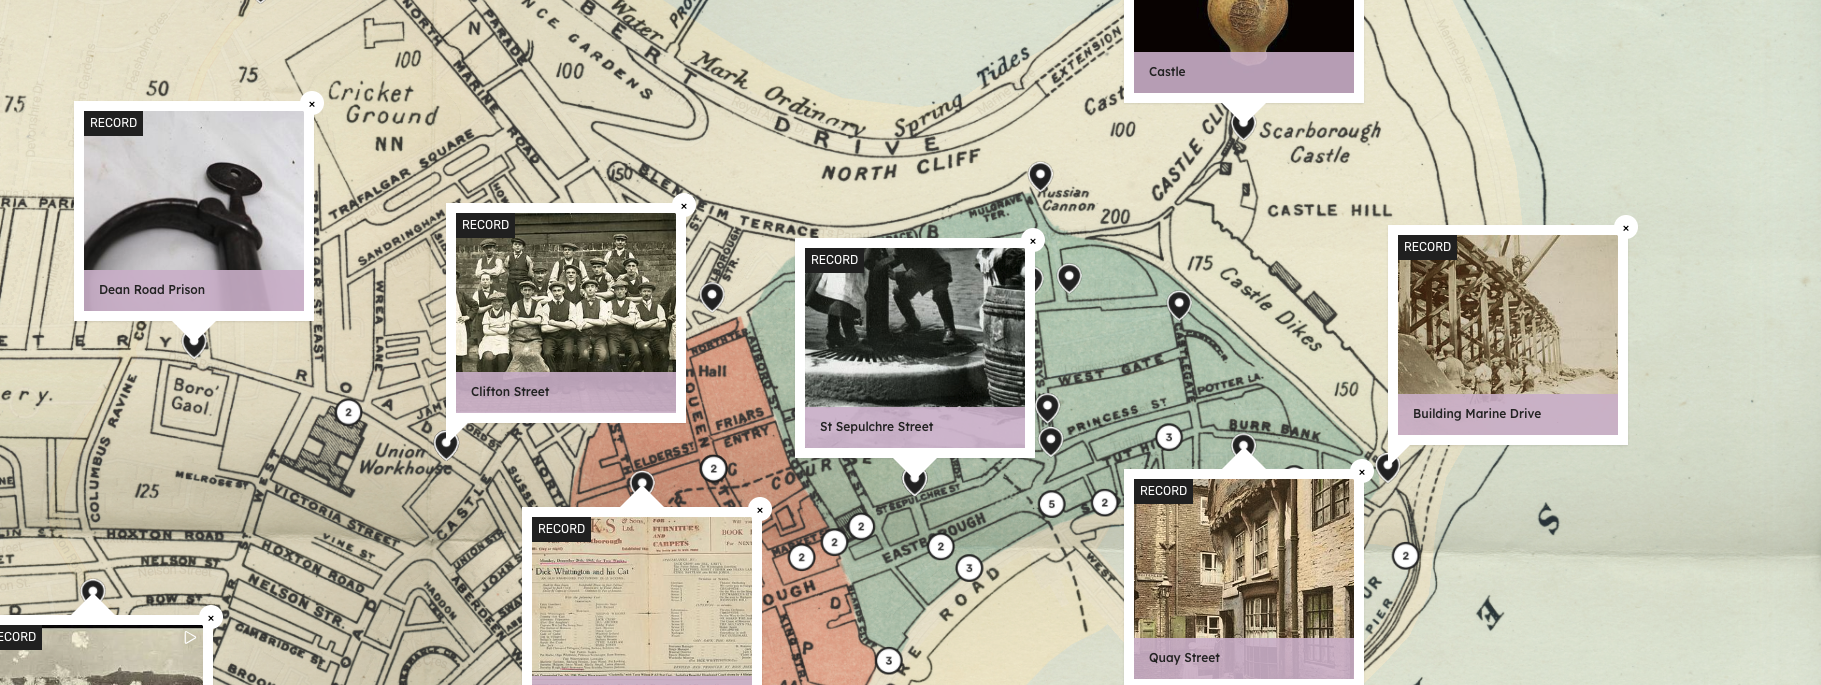
On the Refugee Map, every black pin is a record about a time in someone’s life.
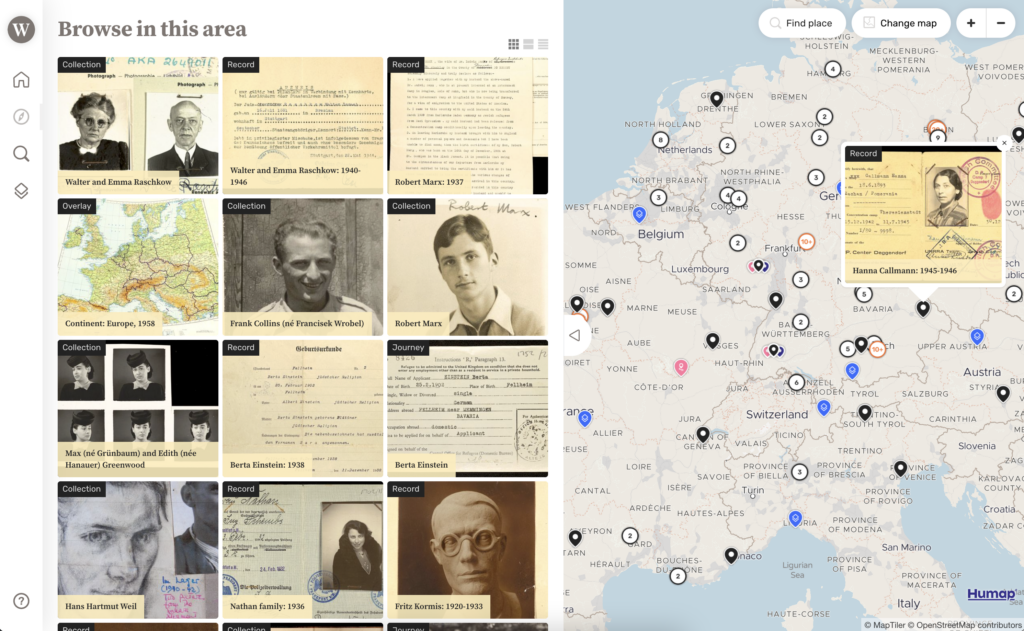
In each record there is text giving a broad overview of this part of the subject’s life and a gallery of primary sources relating to the text. These are often documents, passports, visa applications, school certificates, diaries and family photographs.
Collections on the Refugee Map piece these moments together to create a full account of someone’s life over a period of time. For example, the Lotte Jaslowitz collection begins with her childhood in Romania, her incarcerations in the Ladijin Concentration Camp and the Tiraspol Ghetto, the deaths of her husband and daughter, and ends with the life she built for herself in London as a barrister.
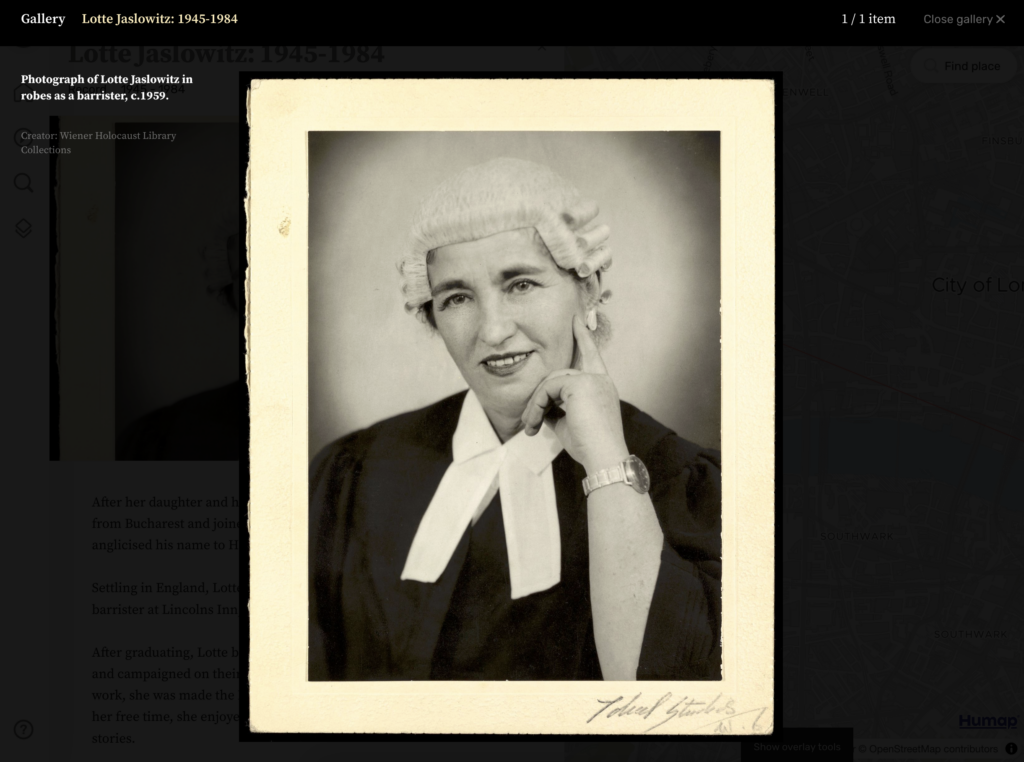
The focus is on individual people and stories. Where possible, the primary images used are photographs of people, often intimate family portraits or grainy candids. The scale of the atrocity of the Holocaust, and its discussion in the abstract, can reduce millions of innocent people to a statistic. By focusing on individual stories, the Refugee Map places the humanity of its subjects front and centre.
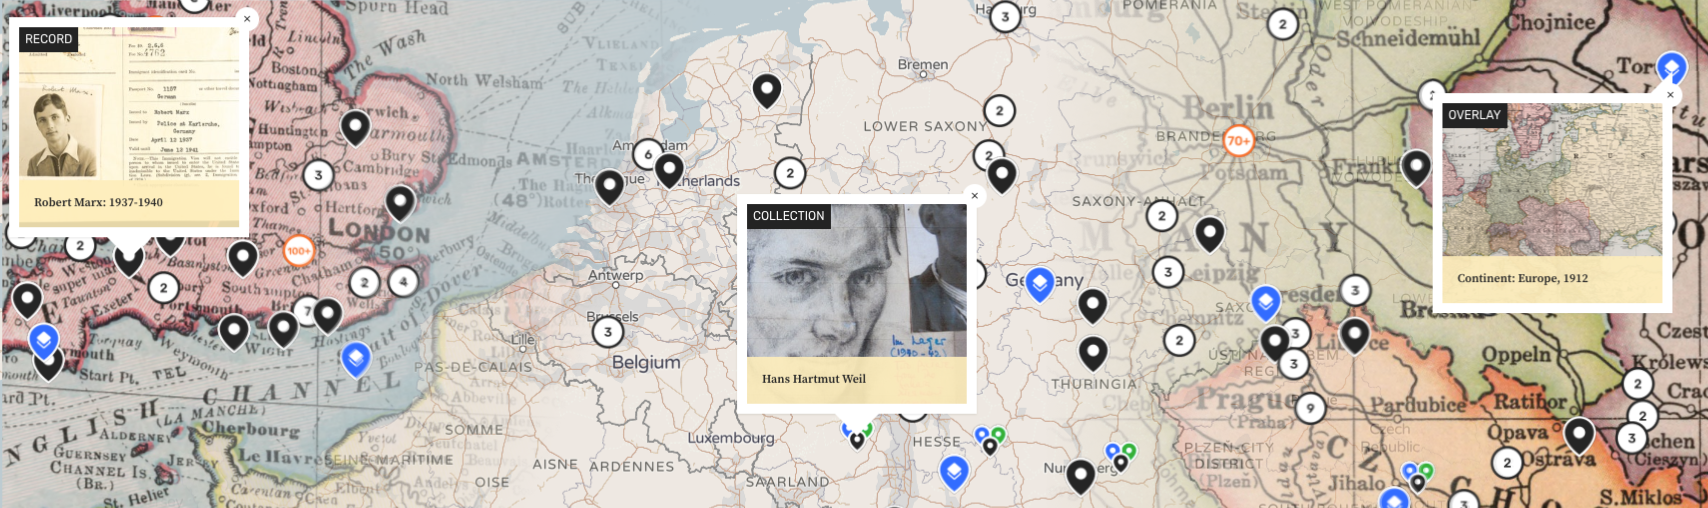
The Library also uses overlays to make historical maps of Europe and the world viewable. Layering maps from 1880-1946, you can see the borders of Europe move and shift as wars of unification, expansion, and ultimately the two World Wars and a burgeoning Cold War touch the millions of lives contained within the pen-and-ink illustrations.
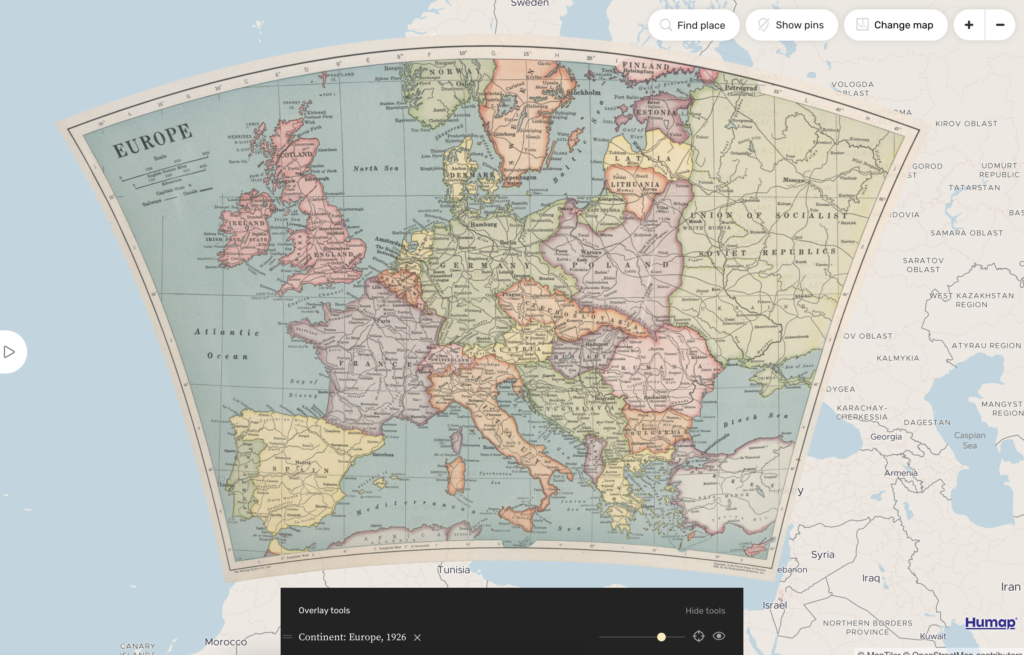
In the Refugee Map, the geopolitical and the personal appear side by side. The overlays add geopolitical context to personal experience, while the stories within each record bring a personal dimension to the geopolitical.
Learn more about the Refugee Map on their case study page.
Layers of London
Where the Refugee Map is highly curated and intentional, Layers of London is uncurated and uncuratable. Anyone can sign up and add content, and the story map has over 6500 users and tens of thousands of items, the vast majority of which were created by members of the public.
The others were contributed by partner institutions of the IHR; the British Library, the London School of Economics, and the Museum of London Archaeology to name a few.
Layers is a democracy. A record on the history of the Barking & Dagenham Nandos, written by a school pupil, can exist side-by-side with a highly polished record created by professional.
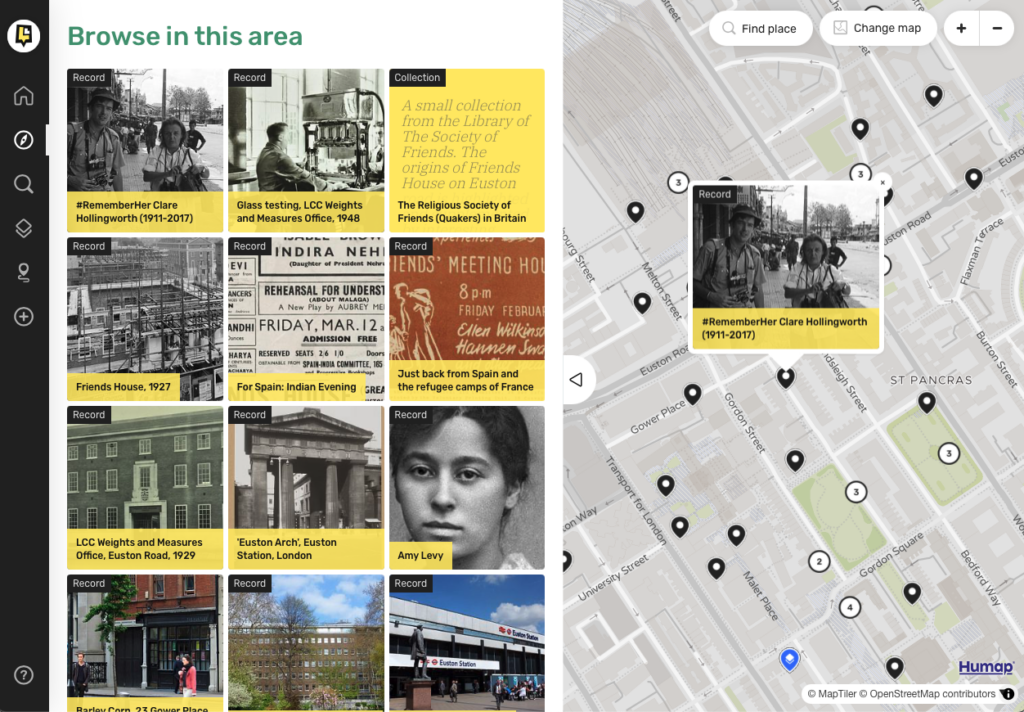
In both cases, the story map is being used to add context to the data it contains.
To use the example of the Barking Nando’s, the building served as a cinema for decades and was severely bombed during the Second World War. During testing for Layers, several children in one class chose to write about it. On the surface this may seem amusing, but to those pupils it was clearly a site worth exploring.
On Layers, you never know what you’re going to find. There is an entire collection on odd vents in the city, and a group of very dedicated volunteers are trying to map every pub in London.
Layers of London has also become a popular place for people to share the stories of their community. To use just one example, Everyday Muslim has used a wealth of primary sources and media to map the experiences and impact of London’s Muslim community.

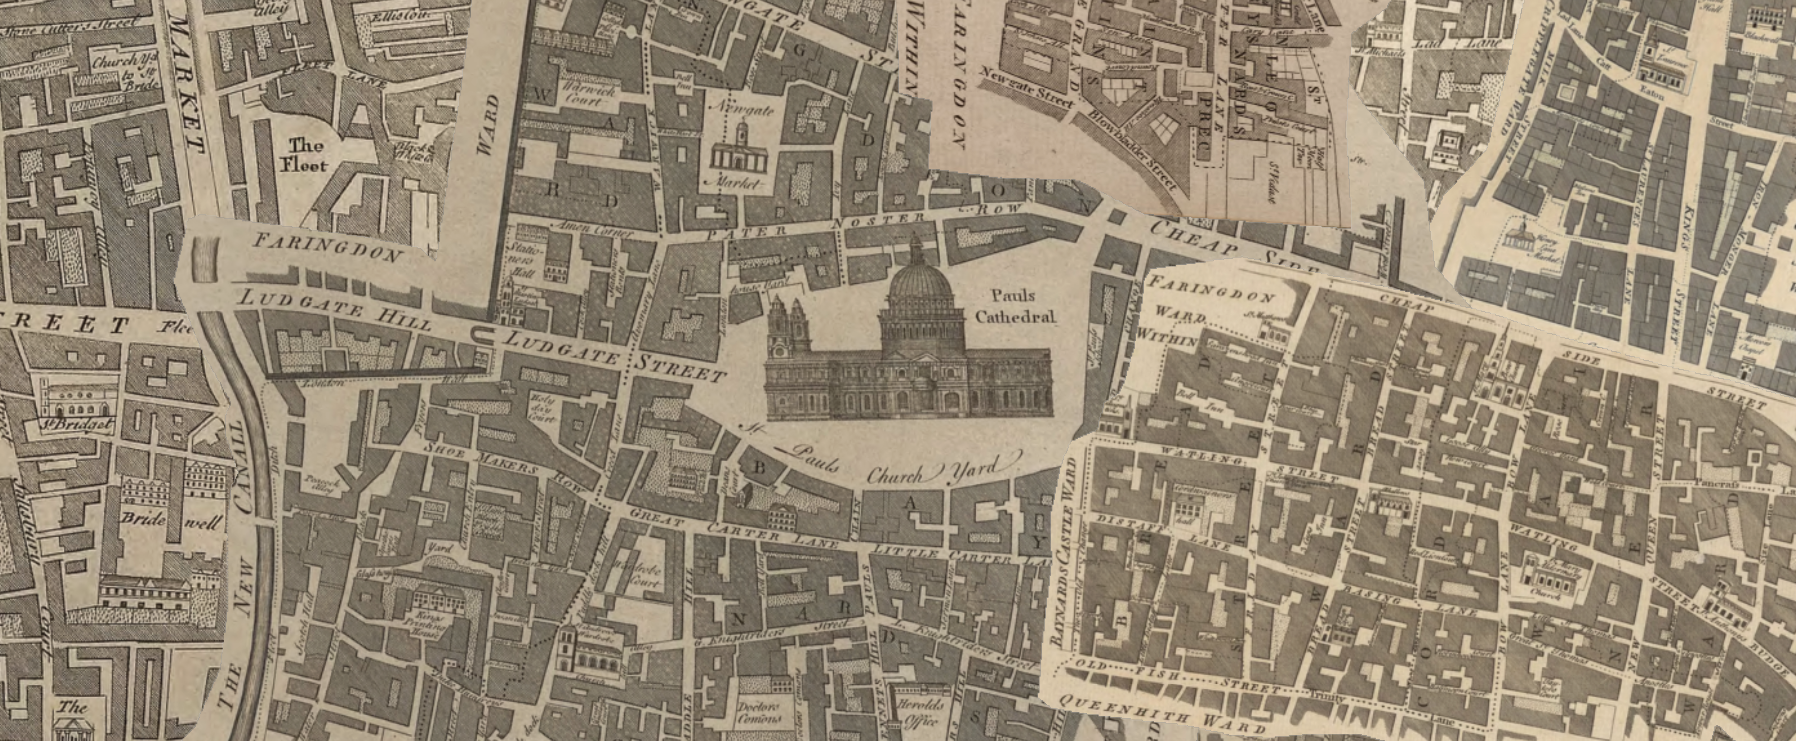
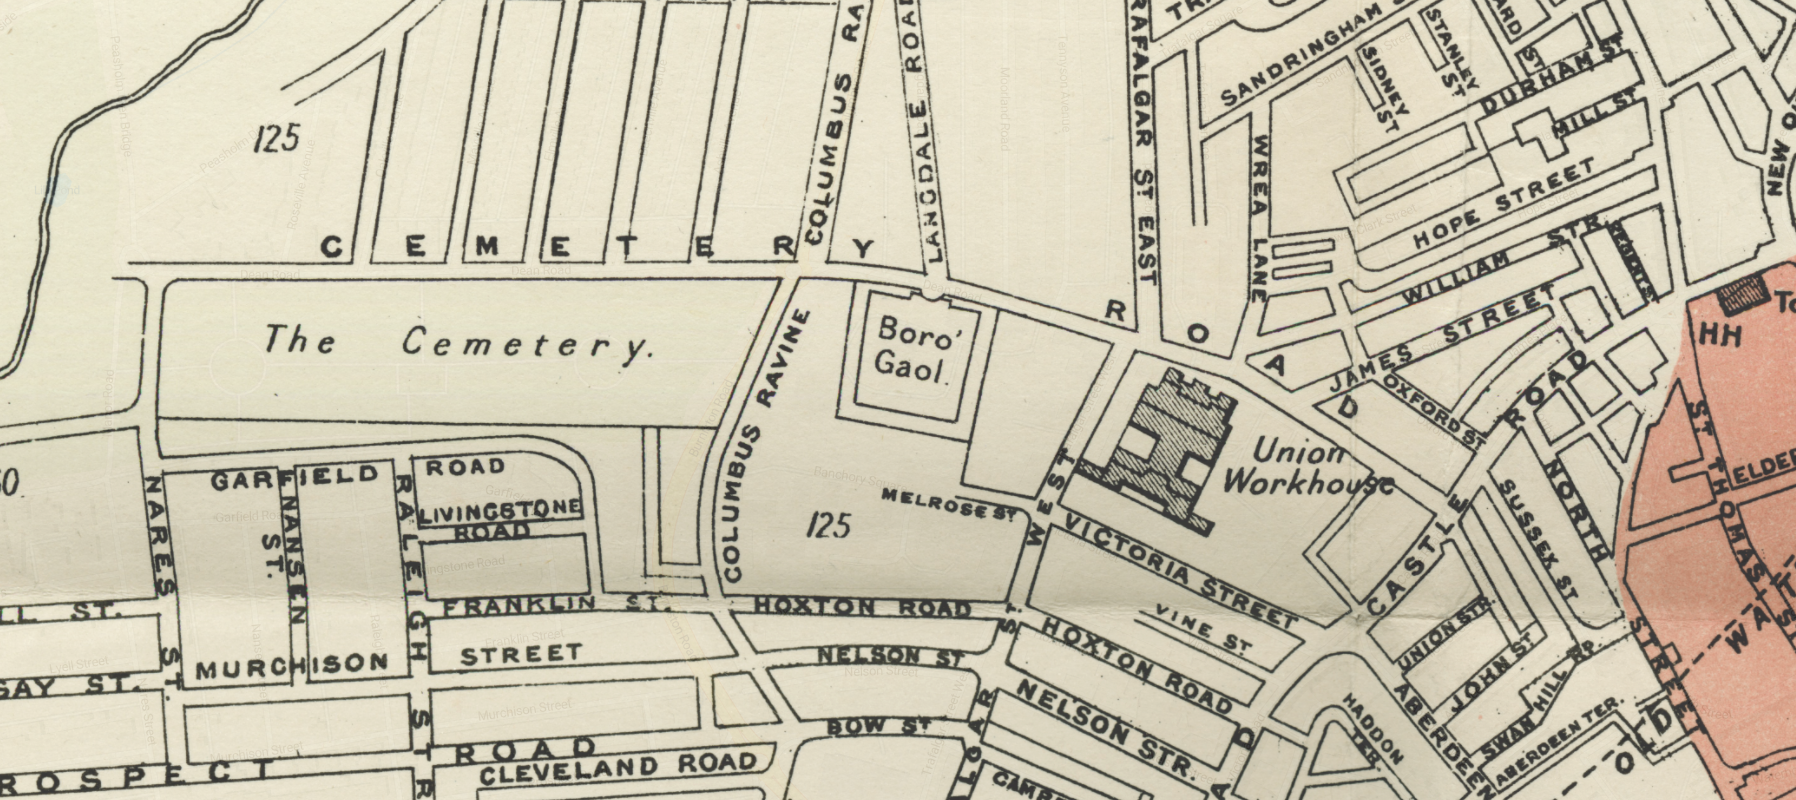
Layers of London also includes a wealth of georectified historical maps, aerial photographs, and spatial data overlays. London has been occupied more or less continuously since the Neolithic period, with each era building on the layers left by the ones before it. Explore archaeological maps, bomb damage, Victorian poverty or Tudor London. These are old streets. Layers helps us appreciate that sites of contemporary activity – like a Nandos in Barking – meant something very different to the Londoners of the past.
You can learn more about Layers of London on their case study page.
Tampa Through Time
The University of South Florida’s Tampa Through Time story map is comparatively light on text, relying more on the university’s extensive collections of ephemera, photographs and primary sources to create a feast for the eyes.
Led by Dr Amanda Boczar, the team worked with student volunteers and community members to map thousands of collection items across Tampa and the wider Florida area, turning a traditional collections database into a place-based digital exhibition.

Many of these records have been organised into thematic collections, on subjects ranging from the African American Experience in Florida to the state’s Mutual Aid Societies.
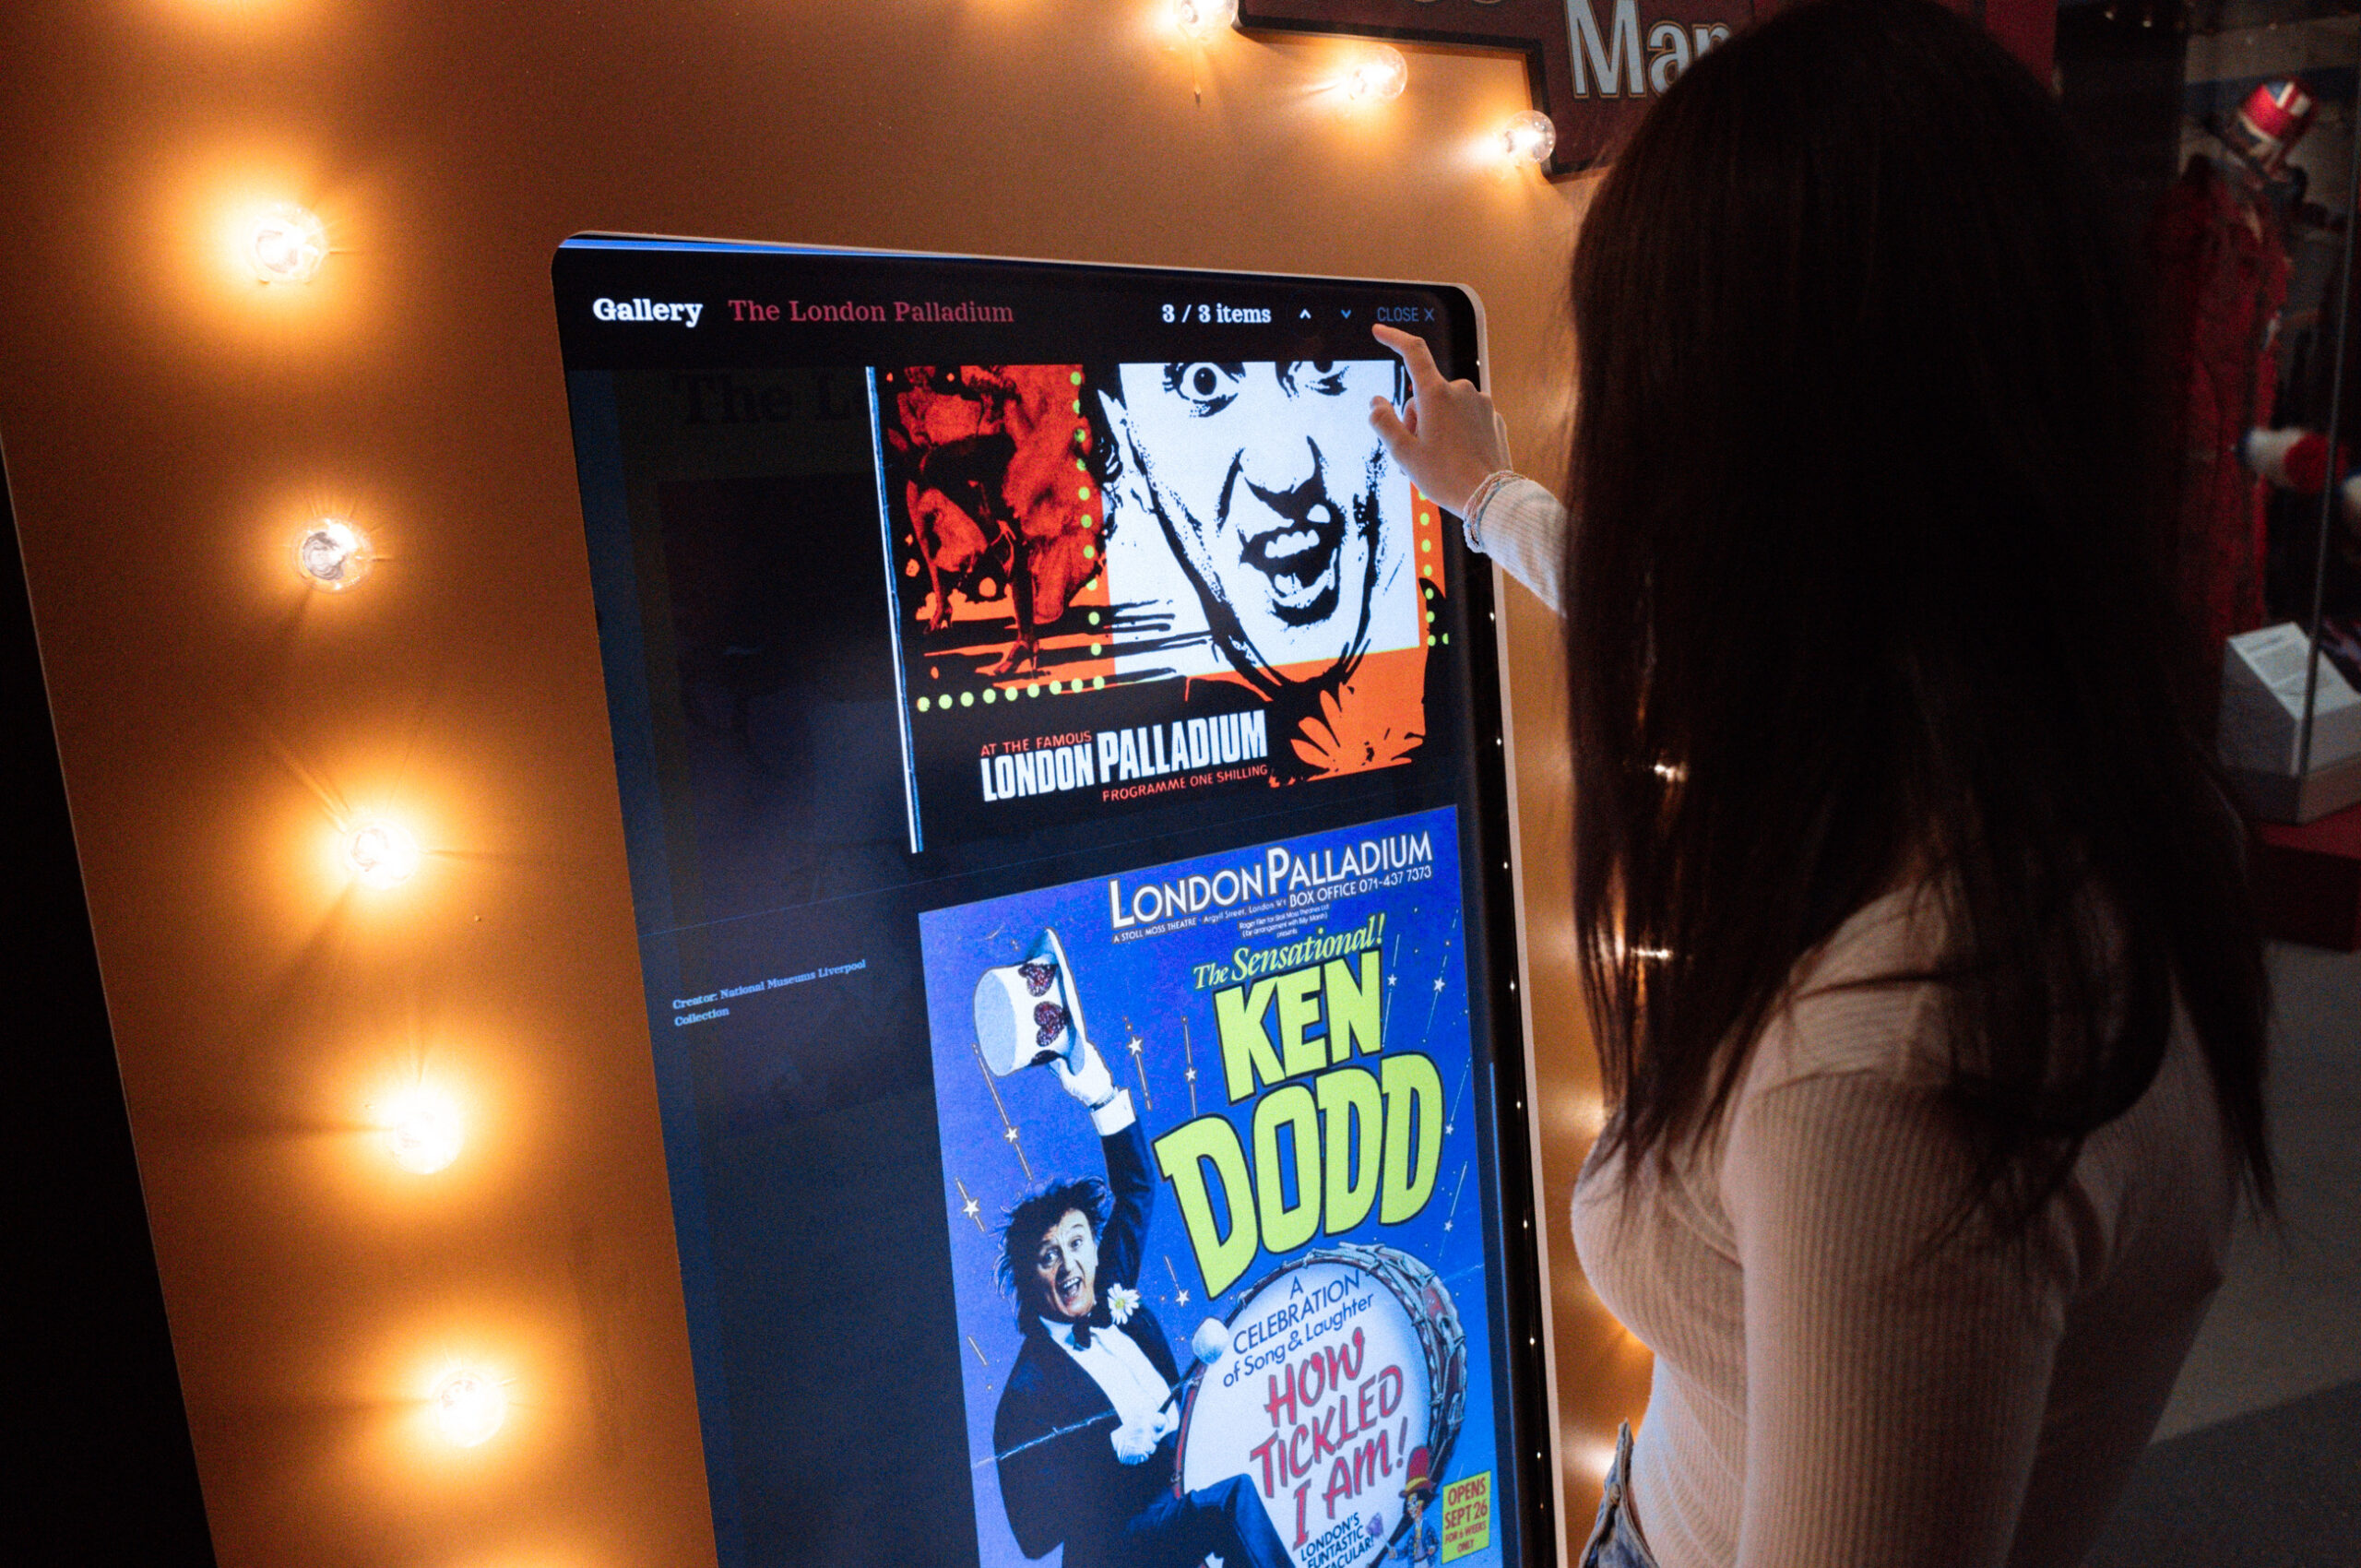
The content on this story map is a mixture of moments of individual lives, family scenes, and everyday life. A menu at a popular restaurant; a parade, a schoolyard, a newspaper clipping – lovingly preserved and expertly presented.
Many of the thousands of items on the website relate to local landmarks, beauty spots, or holiday events. A database presents records vertically and out of context. By contrast, a map situates them almost in place. There, you can explore them alongside historical maps that chart Tampa’s explosive growth over time.
Islington’s Pride
Islington Council’s Islington’s Pride story map documents queer history and contemporary culture in London’s iconic Islington Borough.
Stories of repression live side-by-side with tales of love and liberation. Each record can contain a mixture of oral histories, ephemera, and media. The team curated the map to juxtapose historical accounts with modern stories and media formats, like video or audio recordings.
After all, queer people have always been here, even when the word “queer” didn’t exist. Ultimately, it’s about presence.
There are records from Elizabethan and Stuart England right up to the 2020’s, telling stories of existence, resistance, and community.
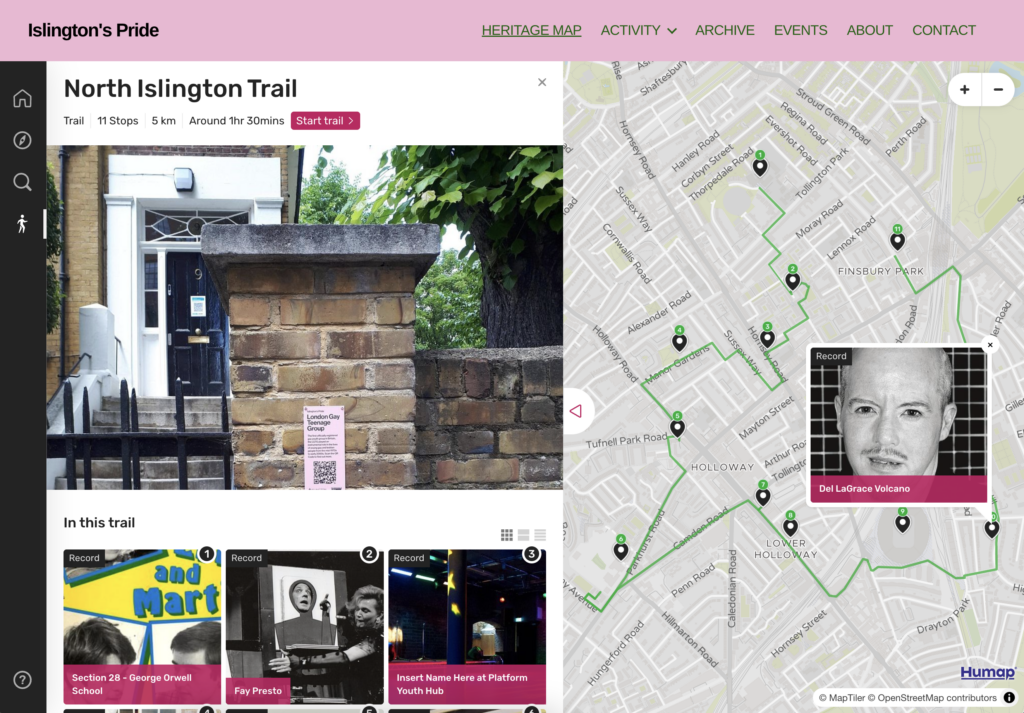
The project team printed QR code plaques and displayed around them Islington, linking people directly to the map. These plaques let people learn about the place they are in with no barrier to entry.
The story map was one part of a wider project to highlight and explore LGBTQ+ history and culture in Islington, along with a series of events and an exhibit.
You can learn more about Islington Pride on their case study page