Set classroom & student projects that get people thinking outside of the box.
Image from the University of South Florida’s Tampa Through Time

Set classroom & student projects that get people thinking outside of the box.
Image from the University of South Florida’s Tampa Through Time


"I’ve found the Humap software to be very intuitive, and it provides us a tool to communicate a story and hard data in a very manageable format. This software will become a staple in University-community experiential learning."
Whether it’s mapping the journey of a historical figure, building a digital tour of local landmarks, or recording oral histories from the community, Humap helps students connect what they’re learning to the world around them.
With Humap, students can:
Humap has been used in universities, secondary schools (ages 11-16), and even primary classrooms (ages 6-11), all with no Geographic Information Systems (GIS) software training required.
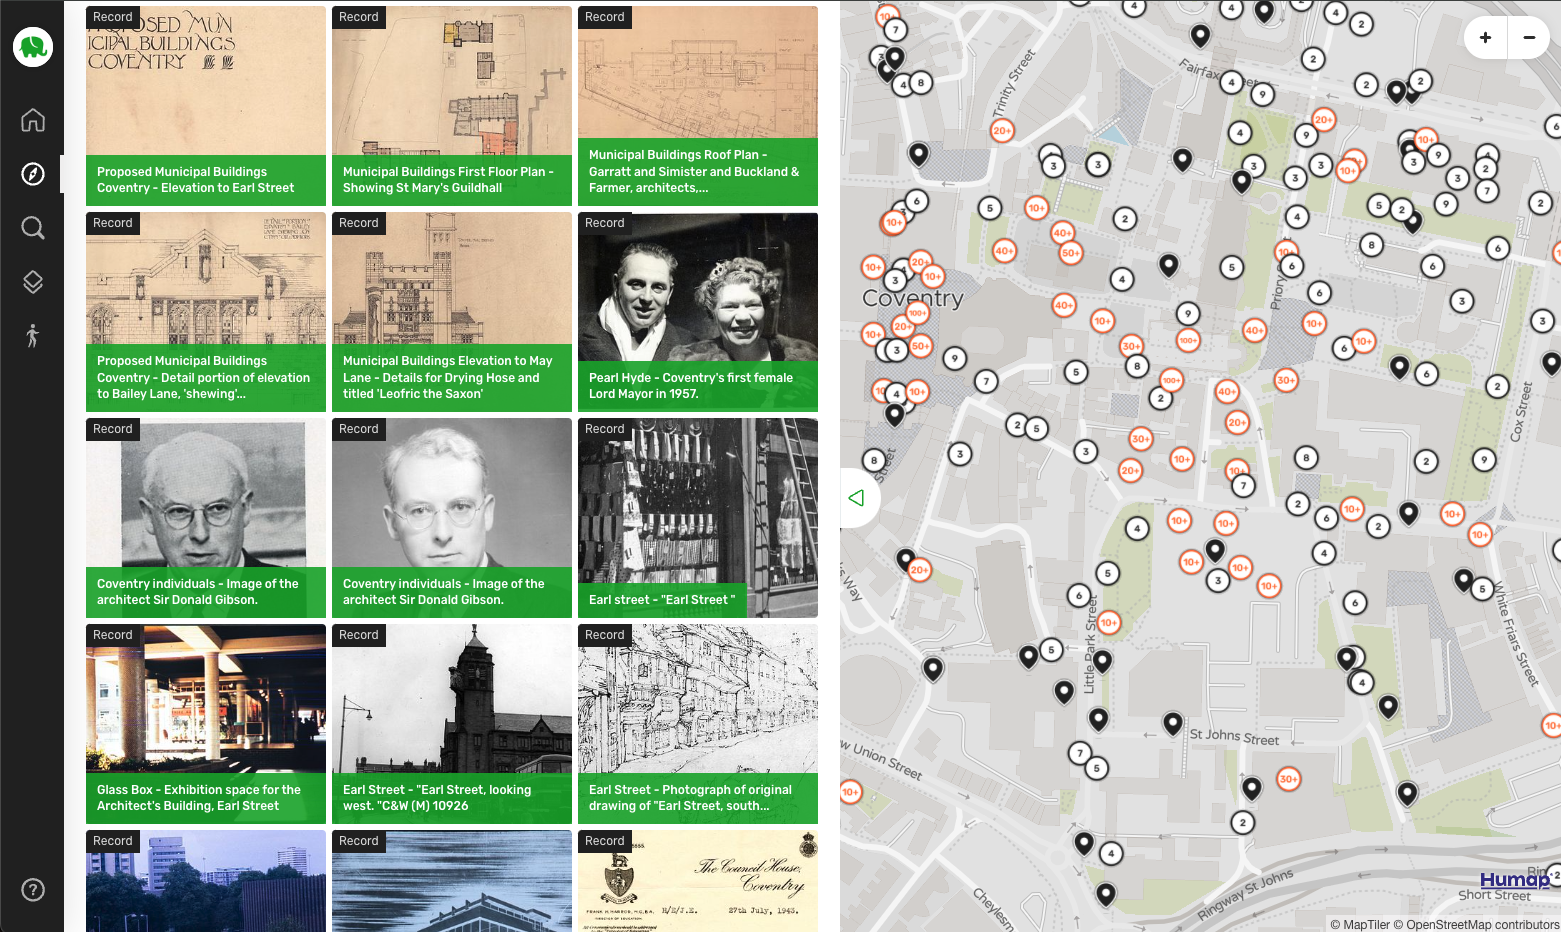
Image from the University of Coventry’s Coventry Atlas
Professor Douglass Sullivan-González has been using Humap to get students thinking spatially. Here’s what he has to say about interactive maps in the classroom:
“I’ve worked with first-year University students at the Croft Institute for International Studies.
We work to train them with several objectives in mind, and one, in particular, focuses on public history or communicating what we know with key stakeholders.
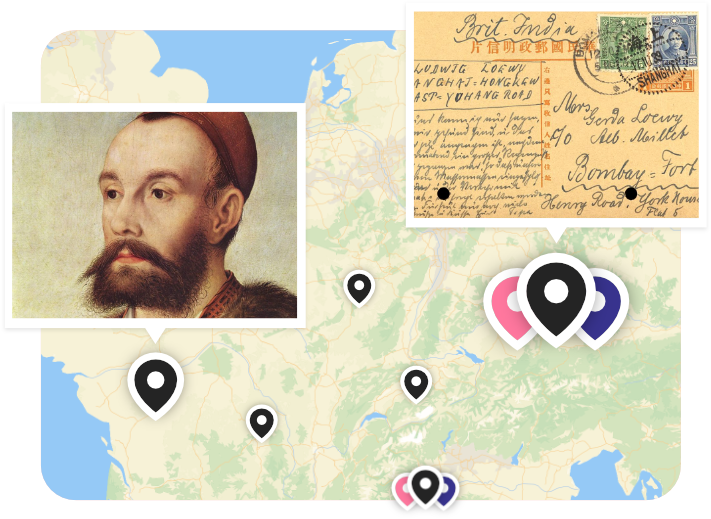
I break my first-year students into teams of five and give them two days to present both a narrative and data of an immigrant’s journey somewhere in the Americas, preferably beginning in Latin America and venturing into the USA (pre-Trump). Each team contributes one “techie” who works with me to learn the Humap software interface in a 30-minute session, and then returns to the group.
Each team then publishes the story of the migrant on the Humap website with a beginning and end of the journey along with three points of destination in between these bookends. The published narrative must include data to illustrate a particular point. Thus, we merge “story” and “trend” into a very communicable platform.
I’ve used this approach for two years now and it works very well.
I’ve found the Humap software through this process to be very intuitive, and it provides us a tool to communicate a story and hard data in a very manageable format. This software will become a staple in University-community experiential learning.”
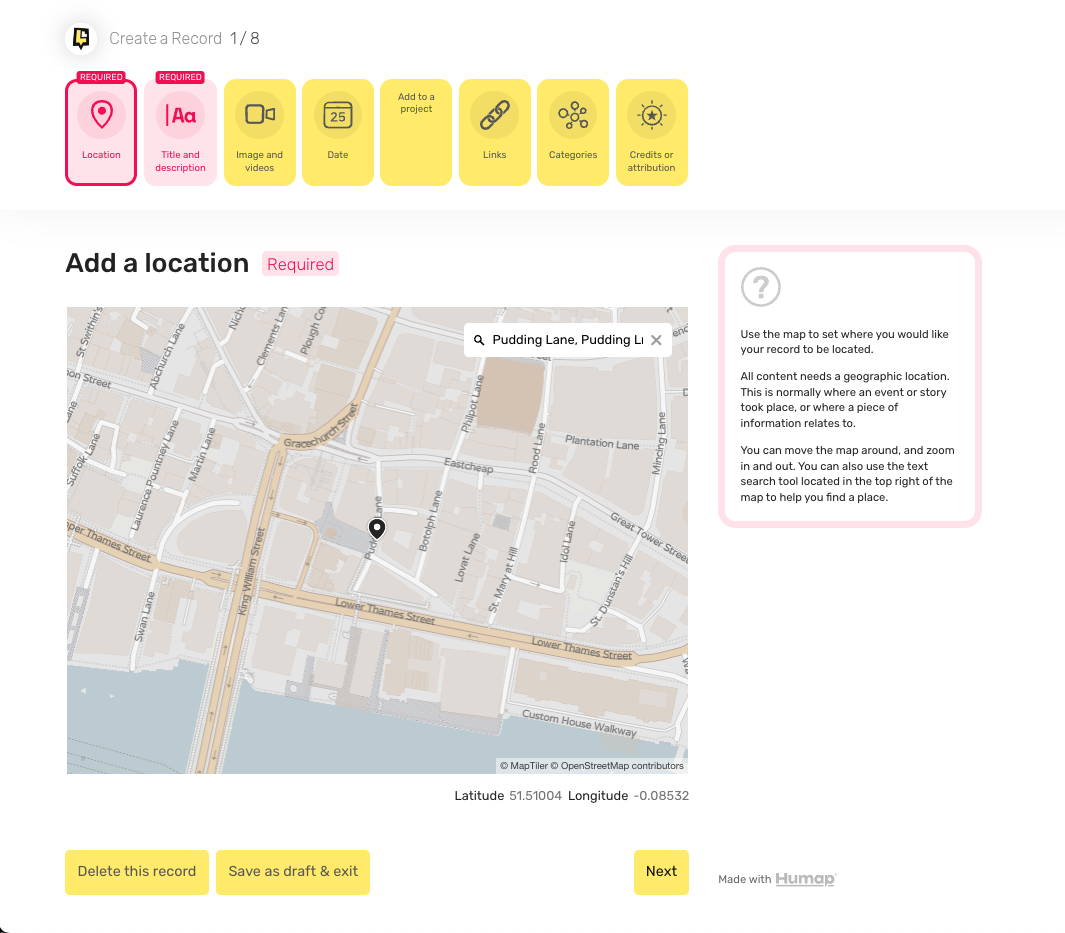
We know educators are overstretched and under-resourced. Humap was designed to support teaching and learning, not create more admin.
Humap fits beautifully into classroom, fieldwork, or remote settings
Image from The Institute of Historical Research’s Layers of London
No installations or logins required for viewing
Works on tablets, phones, laptops, and shared computers
Single Sign-On available (Google, Microsoft, Apple)
Customisable privacy settings: keep projects private, semi-public, or fully published
Content moderation tools to keep students safe
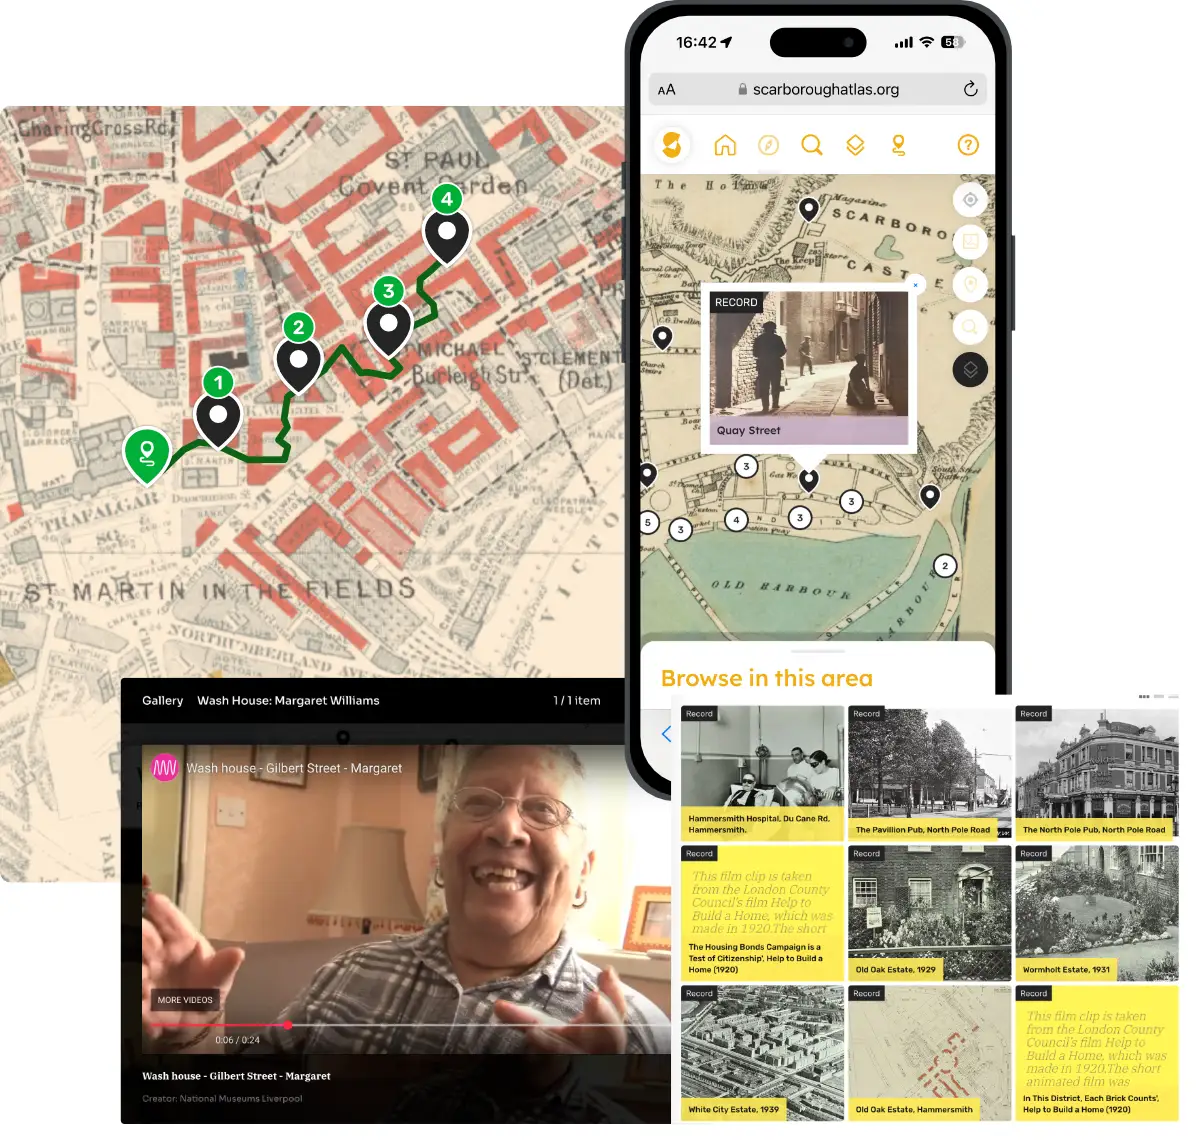
Image elements taken from the London School of Economic’s Charles Booth’s London, The Institute of Historical Research’s Layers of London, Scarborough Museums & Galleries Scarborough Atlas, and the Merseyside Maritime Museum’s Mapping Memory.