From archival documents to archaeological finds, story maps are an extremely popular way of reimagining and visualising data. At Humap we work closely with our clients to create their maps and quite often we’re asked the same questions.
In this blog series, we’ll be asking our clients why and how they curated their Humap projects the way they did. Hopefully, this series will be useful to anyone embarking on a mapping project, regardless of their chosen platform.
What do we mean by imperfect spatial data?
In this context, spatial data is imperfect if we don’t have a specific location to anchor something to. To use Humap as an example, most of our clients are in the cultural heritage or academia space, and they come to us when they want to map archives, research, or collections. Quite often they simply do not have a location for something they would like to turn into a record pin.
Samina Richards, project lead for the Wiener Holocaust Library’s Refugee Map, gave the example of only having partial paper records or family anecdotes to refer to. Several of the records on the Scarborough Atlas aren’t from Scarborough, but are pinned to locations that fit the story Jim Middleton, the Collections Manager, and Scarborough Museums & Galleries (SMG) wanted to tell. In both cases, the project leads had to make curatorial decisions on where to locate content.
Anyone interested in using maps to tell stories will find themselves asking that thorny question: where should the pin go!?
The Scarborough Atlas
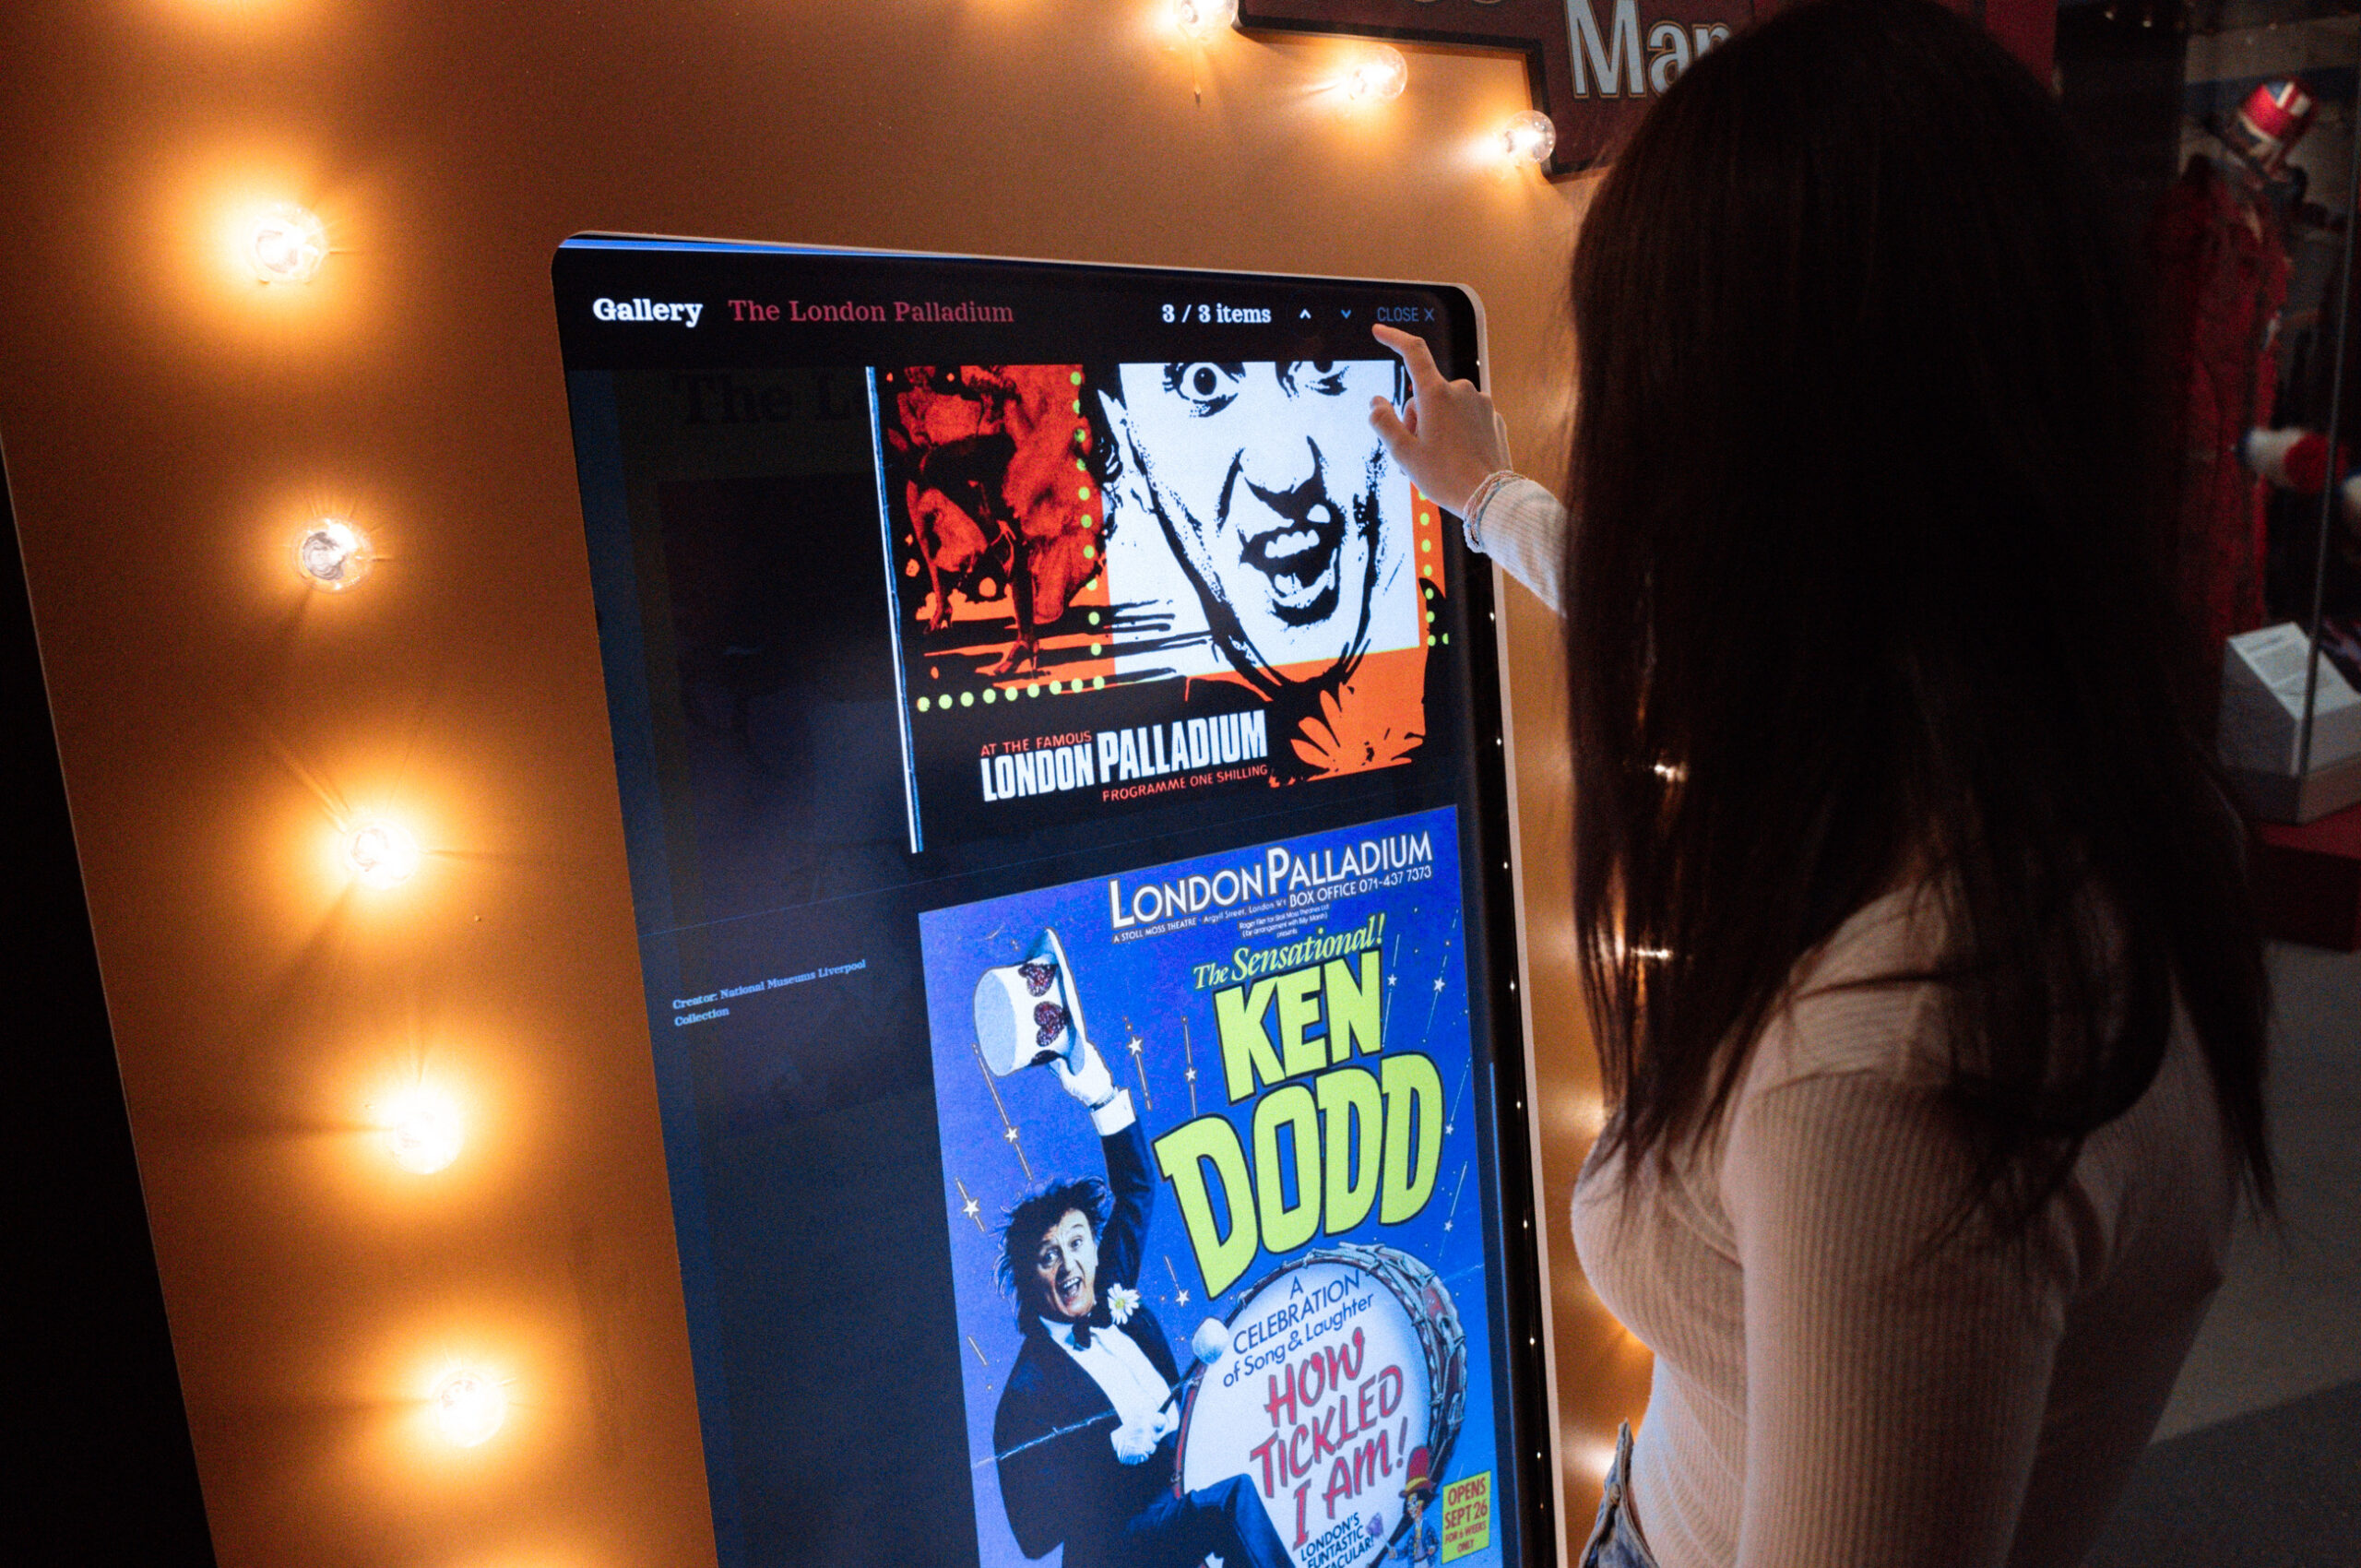
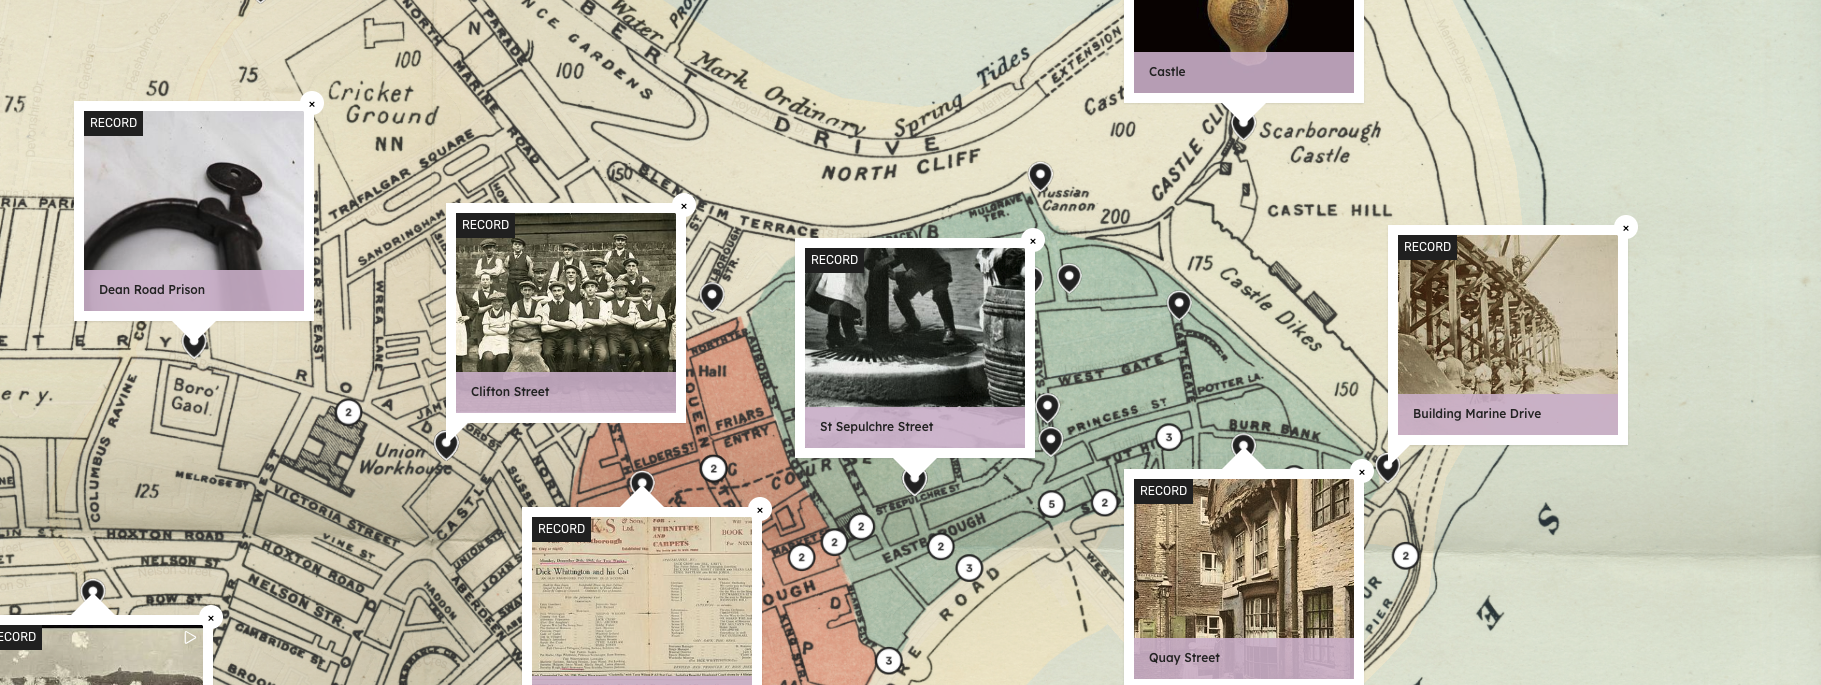
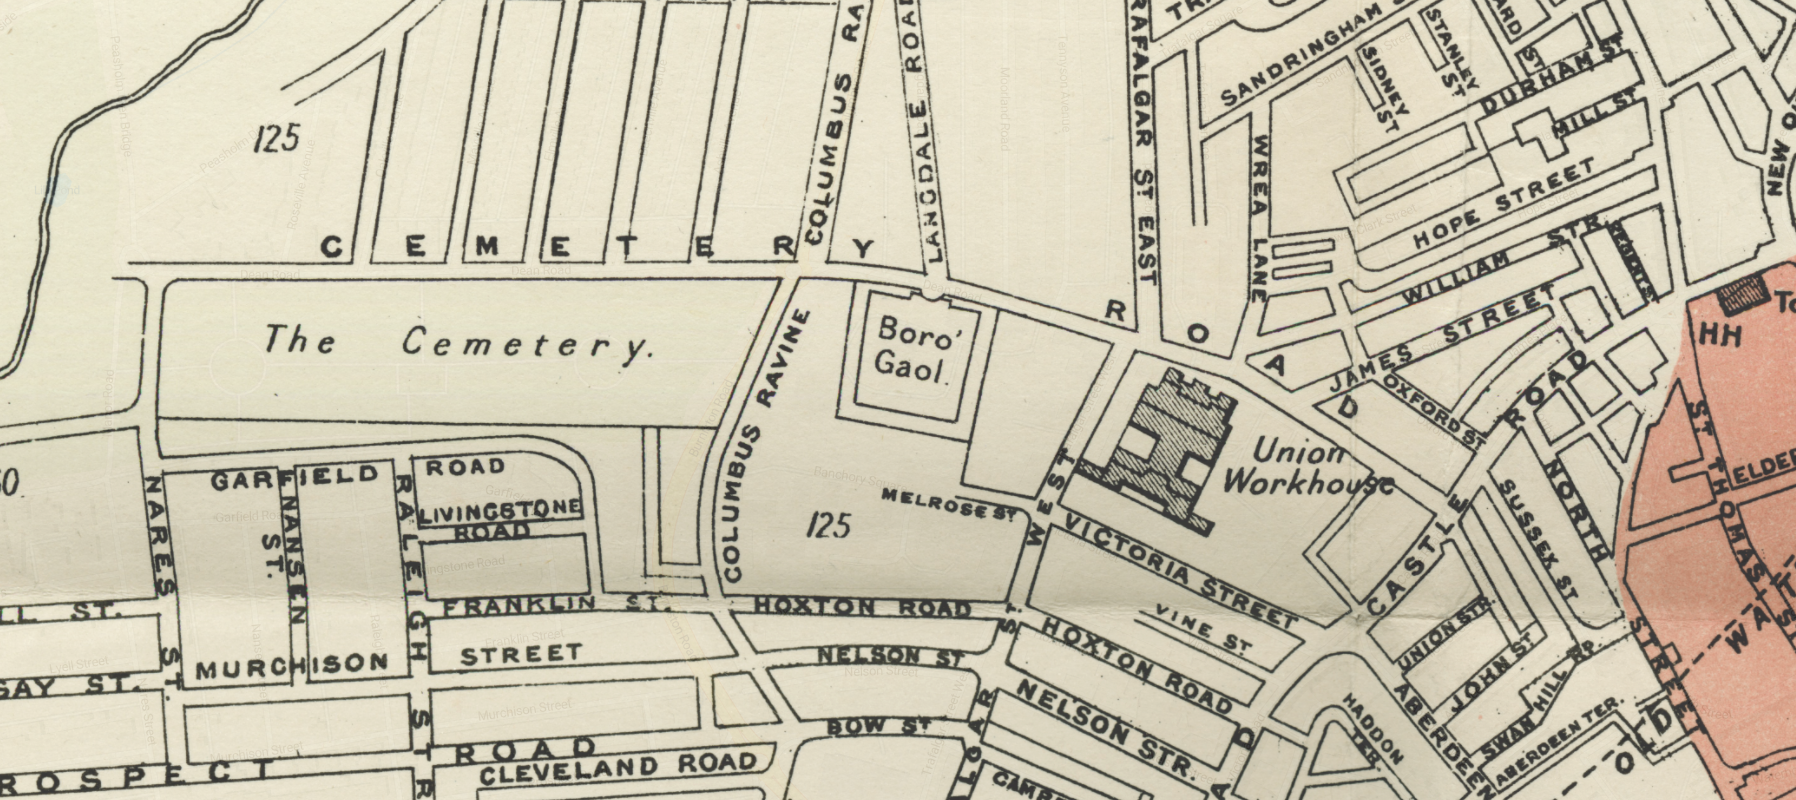
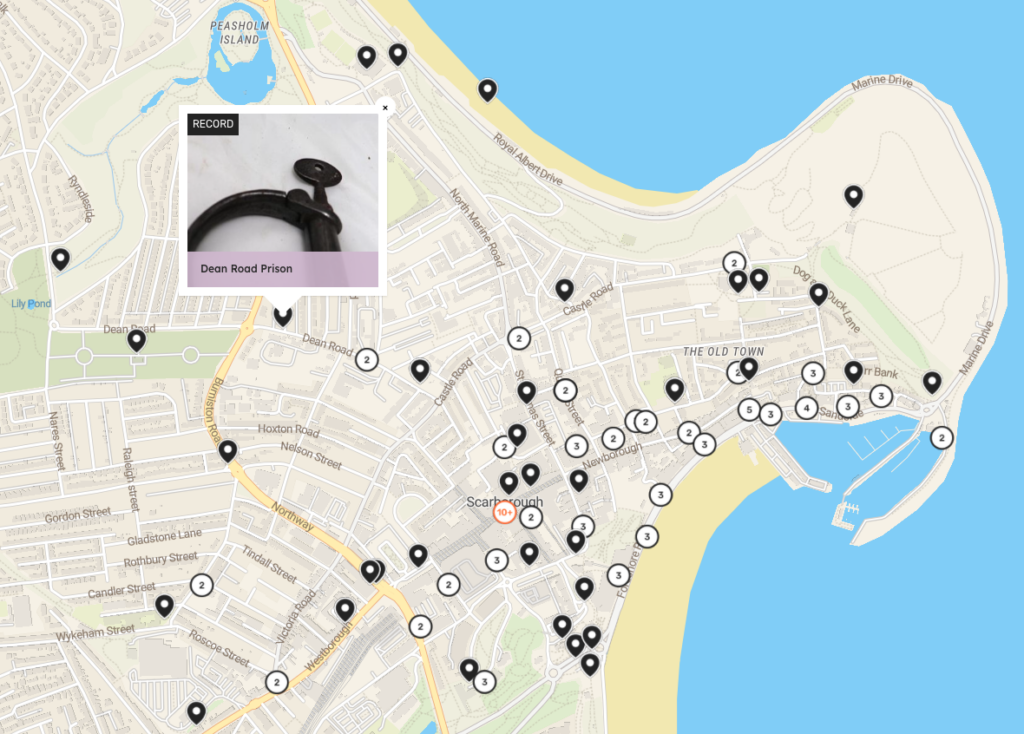
For Jim, this is all part of the fun. He led on the Scarborough Atlas project, a digital expansion of the physical exhibits at Scarborough Museum that celebrates local history.
Taking something and turning it into a story is, to Jim, “what museum work is all about.” He gave the example of several Roman coins that are in the collection of SMG; these coins weren’t minted in Roman-era Scarborough, nor were they found there. The human stories behind the coins, their movements, the people who carried them – that is where the heart of the story is. And in museum work, it all comes back to stories.
He doesn’t see things on an interactive map needing a location as a limitation of the medium, but more as an extra dimension that can be used to get creative and think laterally. Several volunteer citizen researchers contributed to the Atlas, and the placement of pins was a hot topic.
Jim gave the example of a police truncheon and set of handcuffs. They’re probably not from Scarborough, but it’s “figuratively and descriptively” apt for the record pin to go on Scarborough Police Station as the Atlas is a local history map project.
The Refugee Map
The lack of complete spatial data has also been a consideration in the creation of the Wiener Holocaust Library’s Refugee Map. The Refugee Map tells the stories of primarily Jewish refugees fleeing Nazi-occupied Europe in the mid 20th century. This interactive heritage map acts as an educational resource and a more user-friendly introduction to their more traditional collections database.
Records on the map are based primarily on family papers and documents from the Library’s collection – the oldest such collection in the world. There often is not precise location data available.
There isn’t as much room to creatively interpret the real lives of refugees as there is to interpret Roman coins or manacles, though. The project lead, Samina Rickards, and Helen Lewandowski, her forerunner in the role, opted to place the record pin in the central most relevant place.
For example, if they know an event in someone’s life happened in Berlin and they have a district name but no street name, they will place the pin in the centre of that district. It’s as faithful to the original data as it can be but still requires a small leap of the imagination.
There is a clear limit though; Samina told me that if there is no location data at all for a part of a story – not even a country – she wouldn’t put a pin down but would mention it in the text of a pin at their next known location.
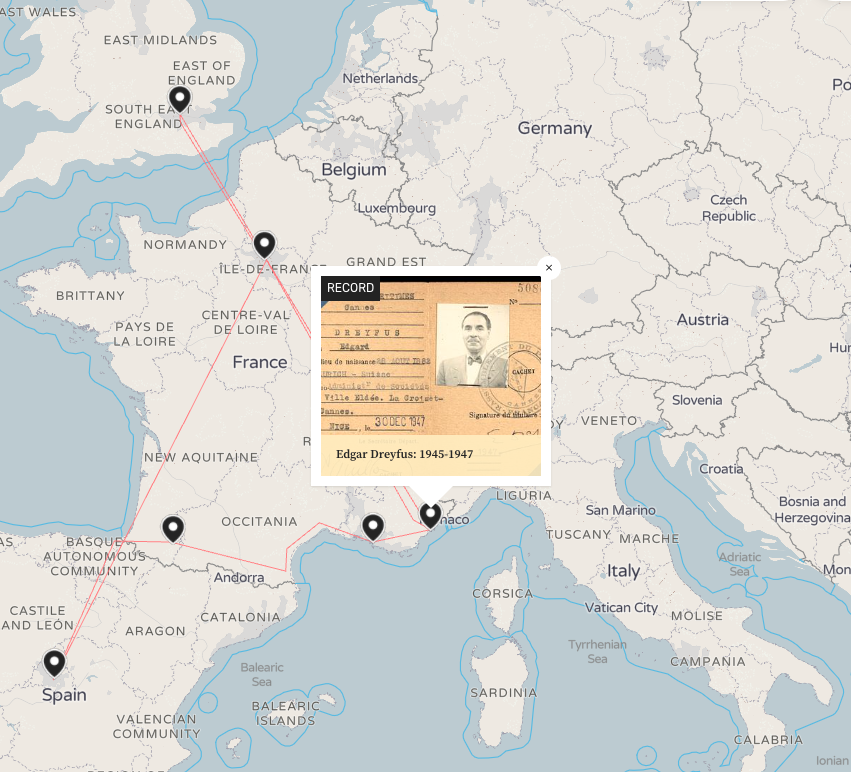
The Refugee Map also involves some creative interpretation on the routes taken by refugees. In the example of the Edgar Dreyfus collection, a route has been drawn to illustrate his travels throughout Europe in search of safety. Some of the route is exact, but other sections either show direct lines where there is no data, or slight guesswork where there is imperfect data.
In a fantastic blog for the European Holocaust Research Infrastructure, Helen reflected on how they had tackled this issue on the pre-Humap version of the Refugee Map. Each collection of family papers had a single pin, usually located above the last known address of the refugees in their home country. As a result, most of the pins were clustered in Vienna, Berlin, and other cities and the amount of archival data within each pin was quite inconsistent, often containing content that related to locations other than the one the record was pinned to. They took this learning forward and created collections with multiple locations in the map’s second iteration.
Facing the Past
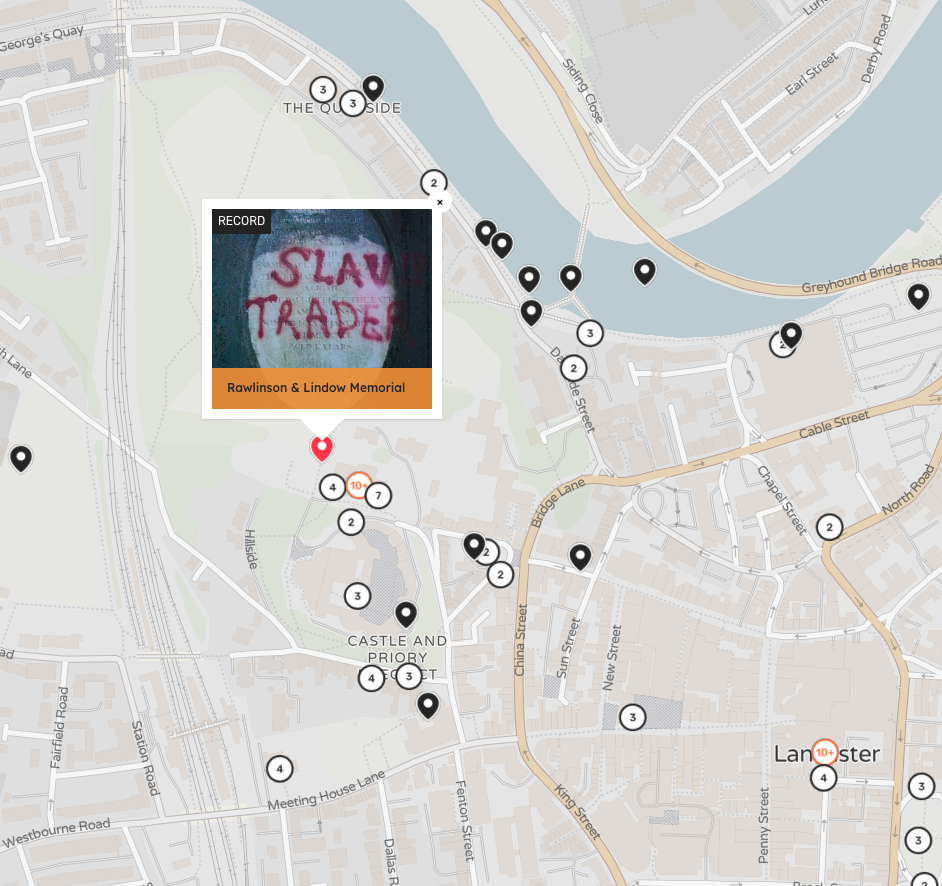
Kit Abramson is the Programme Director for the Facing the Past. This interactive history map explores Lancaster’s hidden links to the Transatlantic Slave Trade and its reverberations in the present day.
Answering the initial question of “but where should the pin go?”, Kit said that, as the archive they’re creating is entirely new, that they only “wanted to work with known facts with solid evidence of geolocation.” They added that “future caretakers of the archive will likely run into this” issue.
100 Years of Mile Cross
Simon Floyd argued that contributing to a story map necessarily involves a leap of imagination. He’s the project leader for 100 Years of Mile Cross, a crowdsourced oral history map project by The Common Lot theatre company documenting life in Mile Cross, one of the oldest council estates in the UK.
By 1935 the estate had over 5,000 houses – where do you put a singular pin for that momentous achievement? The pin isn’t where the first house is, or even the last. It’s where the plaque commemorating the completion of the estate is. Simon argued that this is the most thematically resonant location for it to go. It encapsulates the essence of the story – a story about the political will to see people housed in the aftermath of the First World War and the immense labour and coordination it took to make that happen in Mile Cross.
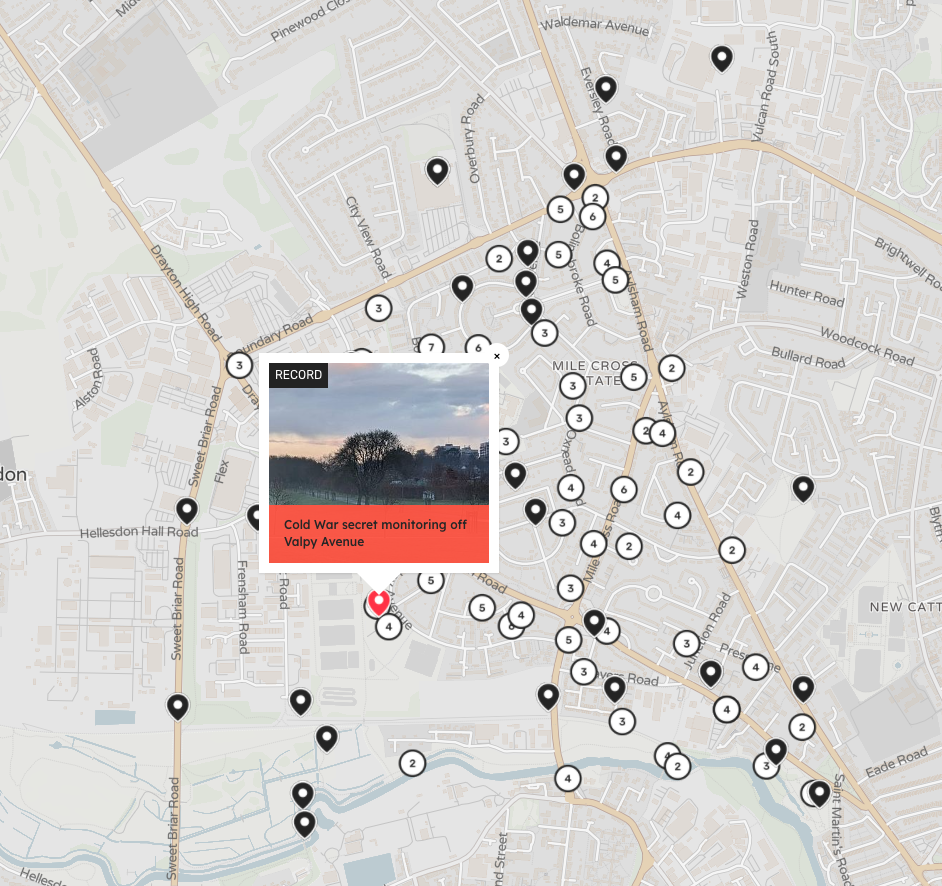
For another example, during the Cold War Norwich was used as a guinea pig for a government test on how fine particles disperse in the air in an urban area. Planes dumped zinc cadmium sulphide powder over the city and measured how thickly it fell at various sampling stations across Norwich, three of which were in Mile Cross. The powder fell all over, but the pin on the map is at one of the boxes, a landmark related to the story.
Simon also emphasised that “creativity is a risk” that often needs to be encouraged. The Mile Cross heritage map relies on volunteers contributing their stories, and Simon told me that people who have felt disenfranchised or ignored by traditional cultural heritage organisations need encouragement to reimagine their stories. As Jim said, reframing existing information and content for a new medium is all part of the fun, an excuse to warp the content and medium around each other until you create something new.
I’ve had similar issues with the map I’m building of my family history. It’s full of creative interpretations of census documents and more than a little bit of guesswork…but that is all a part of the fun. My grandmother was born into a travelling circus and used to sleep under the counter when her mum was working the sweets stand (and her dad was boxing rubes). It’s a story worthy of a pin but we have no spatial data for it – where would that pin go? I haven’t been able to find the name of the circus or its route, so the pin in Norwich, where her family eventually settled not too far from Mile Cross.
Mapping ethically
For Kit, it’s not just a curatorial question but an ethical one. Sharing the locations of, say, a slave trader’s ancestor’s grave – or the grave of an enslaved person – runs the risk of that site either being desecrated or becoming a place for potentially contentious pilgrimages. Several Lancaster residents expressed concerns for their own safety if the historical links between their family home and the slave trade became known.
This has also been an issue for 100 Years of Mile Cross. Someone who spent their entire life living in the estate will be a fountain of knowledge, but putting “their” pin on their actual home location is at best invasive and at worst actively dangerous.
This highlights other curatorial questions: how can you tell living stories safely on a platform that revolves around place and location? How can you protect your sources? Where is the line between democratising history and respecting privacy?
In their former lives as a Webby award winning design agency, the Humap founding team created Movable, an oral history map that tells stories of drug abuse and sobriety in the Appalachians. A pin on someone’s house would essentially be saying “illegal narcotics were consumed here!”, so the challenge was to create a map of an area that protected the privacy of its inhabitants. In the end, we designed the map to be a heat map, showing a broad geographic area for every single story, to protect the anonymity and the safety of the people brave enough to contribute.
Accidental misinformation also has to be considered. In the same way that the disembodied curatorial voice has so much authority in a traditional museum label, the placing of a pin implies that the content of the pin did happen in that exact place.
To quote Helen’s EHRI blog, “there are a number of pitfalls in trying to fit archival content within any set format, however flexible.”
Closing thoughts
Maps are one of the most versatile mediums out there; from the hyper scientific and data-driven to the artsy and abstract. I don’t think there is a best practice – only best practices. Kit’s Facing the Past and Samina’s Refugee Map aim to be definitive digital archives, as accurate and precise as possible as they can be without compromising the safety of people living in the present and without missing stories simply due to lack of a definitive location. Jim and Simon are creatively interpreting data (creatively doesn’t mean inaccurately!) to make thematically resonant interactive maps that have room to play around with the medium.
Perhaps it comes down to stakes. Each of these projects are telling stories that need to be told, but Facing the Past and the Refugee Map are keeping the memories of two of the worst crimes in human history alive. There is significantly less room to have fun with your interpretation when the subject matter is so serious.
We’re currently investigating different ways of to express location when there isn’t precise location data, such as the use of area vectors or other visual paradigms that could fit within the medium. If you have any thoughts on this subject I’d love to hear them – drop me an email at [email protected].
In this blog I’ve aimed to provide current and future story map creators with a primer on how Humappers are using the platform, and I hope it’s been useful for anyone wondering which pin placement process is best for their project.
Lastly, an extra special thanks to the Humappers who let me pick their brains about this topic. They’re all a delight to work with and you can support their excellent projects by checking out 100 Years of Mile Cross, Facing the Past, the Refugee Map, and the Scarborough Atlas.