Annotator
The annotator feature allows Contribute and admin users of a Humap project to draw line, polygon, point, and viewpoint map annotations within a record. Annotations can be a useful addition to a record by providing contextual visual data along with the record’s location, media, and content. For example, a user may draw polygons within the record to outline buildings that are visible on a 19th century historic reference map, but no longer exist or visible on a contemporary map.
The feature can be turned on per project within your Subscription platform. Not every project will need the annotator tools.
Within Admin area
Within the project admin area, the annotation tools are available within each record, under the annotator tab.
Within the Contribute system
The annotator page is a step within the Contribute system.
Annotator tools
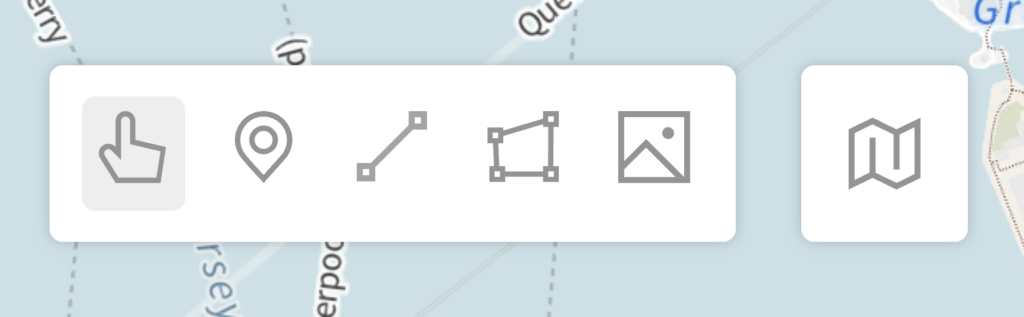
Select

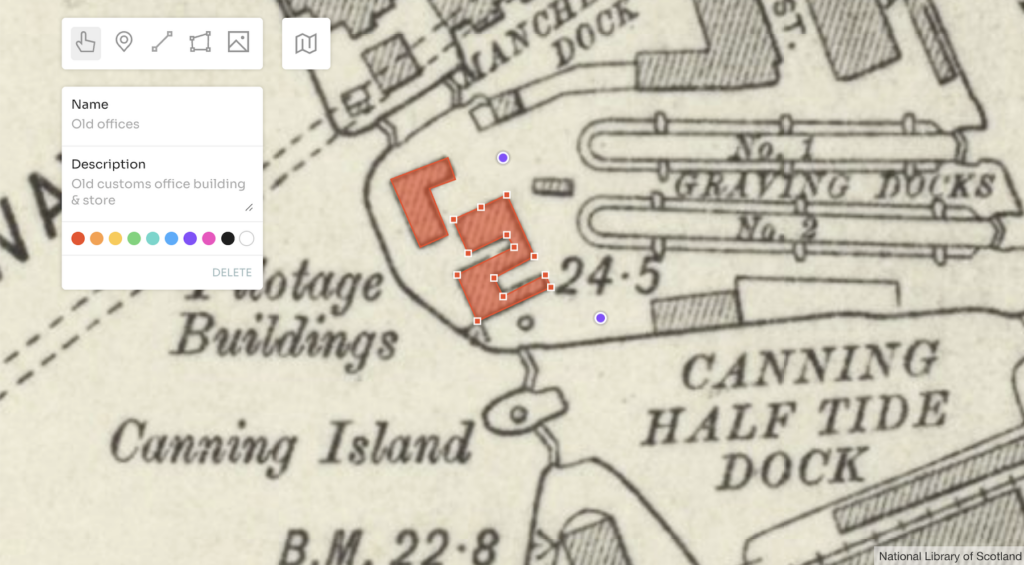
The hand Select icon presents the user with a dialogue panel for each created point, line, polygon, or viewpoint. The following data fields can be completed within the panel: Name, Description, Colour. Name will be the title of the annotation element. Description is a short description of the element. And one of 10 colours can be chosen to colour the feature (point, line, or polygon).
Latitude and Longitude are automatically populated for point data (points and viewpoints) and can also be edited.
The annotated feature can also be deleted from within the Select dialogue panel.
Point

The pin Point icon creates a single point on the map represented by a coloured dot. Useful for smaller or less defined objects such as trees or markers.
Line

The Line icon creates a multi-point vector represented by a thin coloured line. Useful for thin or less defined longer elements such as incomplete boundaries. To draw a line, click on the map to place your starting point and then repeat the steps to continuously draw your line shape. To end the line, double click when placing your last point to escape the tool.
Polygon
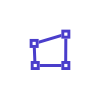
The quadrilateral Polygon icon creates a multi-point vector represented by a coloured polygon. Useful for displaying building outlines or areas. To draw a polygon, click on the map to place your starting point and then repeat the steps to continuously draw your shape. To end the process, double click when placing your last point to escape the tool.
Viewpoint

The image Viewpoint icon creates a single point on the map with a field of view direction indicator, represented by a point and a field of view gradient radiating out from the point. Used is to indicate the point and direction at which a photographer or artist created an associated image. The user must select an already uploaded image to add a Viewpoint to on the map.
Base Map

All available base maps within your project presented as a reference map for creating your annotations.